Editor’s note: Joe Hopper is president of Chicago-based Versta Research.
It wasn’t long after the shock of Election Day that a colleague asked, “What do you think about the validity and accuracy of surveys and polls now? I'd say they’re all hogwash.” She was not alone. “The vitriol targeting pollsters in the last few days has been intense and ugly,” wrote another colleague via the AAPOR online discussion forum.
Most of us in marketing research work outside of election polling but of course any survey research is related to public opinion polling and our methods are the same. If election polling provides the proof that survey methods work, what are we to make of Donald Trump’s 2016 win being a surprise?
Here is my take: This election put research methods to the test and subjected them to public and professional scrutiny like never before. There is much to learn about what works and what does not. People still can’t believe how wrong the survey methods were. As an industry, marketing researchers can learn from these reactions. Some things went right, and some things went wrong. But what?
Let’s look at five lessons to draw from the 2016 election polls.
1. Surveys work. And they work extremely well. This may sound ridiculous in the wake of pollsters’ failure to predict Trump winning the White House but the polls did not fail. It was the attention-hungry people who interpreted, reported and prognosticated based on the polls that failed, and they failed miserably.

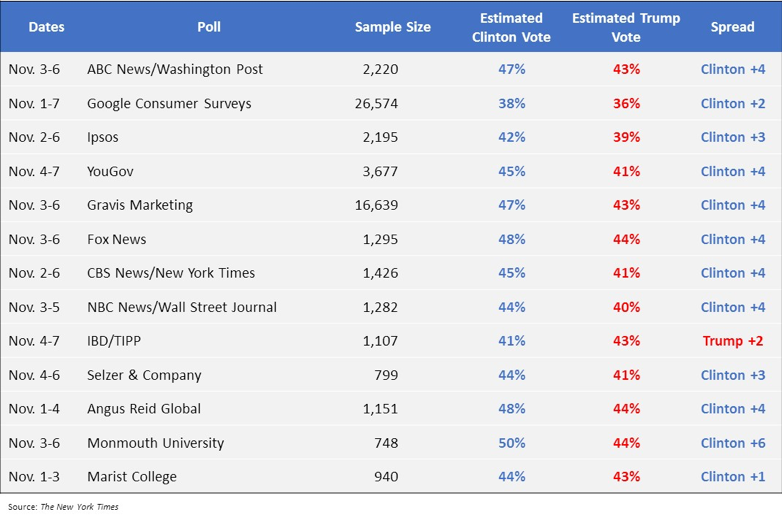
Clinton got 48 percent of the national popular vote. Trump got 46 percent. Clinton won the popular vote by a comfortable margin and nine out of the 10 top polls correctly predicted this. On average, the top 10 polls had Clinton winning the popular vote by 3 percentage points. She won by 2 percentage points.
If you do not find this remarkable, you should. Despite the enormous challenges polling faces today with plummeting response rates and the unattainability of probability samples, the polls – both those conducted online and those conducted by phone – worked.
Suppose you could have a fancy marketing research tool that predicted, within a percentage point or two, how many of your customers would buy your new product over a competitor’s. Would you want it? You can have it. Well-done, rigorously-executed surveys do exactly this.
2. Weight your data. The polls were surprisingly accurate but they got the election wrong. We all know why, right? Election polling measured the popular vote but it is the Electoral College that chooses the president. Despite the popular vote, only 42 percent of electors voted for Clinton, while 57 percent of them voted for Trump.
Because of the ways in which electors are chosen and cast their votes, every popular vote for Clinton was, in effect, down-weighted to .87 and every popular vote for Trump was up-weighted to 1.24. All votes are not created equal.
The inequality of votes is something we know all about in marketing research and it is a good reminder of why we weight – and how important it is to think through it carefully. Weighting data is all about making sure that the people we have in our data accurately reflect the population of decision-makers we care about. If my survey is about buying cars, I need to ensure my sample matches the car-buying population. If I have too many of a certain demographic group in my sample, their votes count for less. Weighting makes that happen.
All pollsters (we hope) weight their data to bring sampling into alignment with the true population of voters. But what if, after weighting their samples to the population of voters, they weighted to the population of electors? If their samples were big enough (most of them aren’t but surely they could be) then polling may have better reflected the population of electors.
Easier said than done. And I say this with trepidation, because the fancy election forecasts did try to account for the Electoral College, though in different ways. Which brings us to our third sobering lesson from the 2016 election polling debacle.
3. Beware the math-meisters. In the months leading up to the election, I looked at the election forecast of The New York Times only once. It struck me as absurd and so I never looked again. And it convinced me never to look at Nate Silver’s FiveThirtyEight election forecast either – Silver being the math-meister inspiration for The New York Times’ efforts.
As if polls are not tricky enough, these election forecasts are complicated mathematical models fed by polling data and other fundamentals (like economic data) to arrive at probabilistic statements about who will win. On July 19, Clinton was declared to have a 76 percent chance of winning. On election day, her chances were up to 85 percent.
But what on earth can such numbers mean? Does it mean that if we were to hold the exact same election 100 times, Clinton would win 85 times? No, that’s absurd; the election happens only once. Does it mean that in the history of all our presidential elections (there have been only 56 of them) the Clinton-like candidate won 85 percent of the time? But wait, we’ve never had a Clinton-like candidate, nor a Trump-like candidate before now.
Fear not, the forecasters gave us helpful guideposts to make sense of it. In July, Clinton’s chance of losing was “about the same probability that an NBA player will miss a free throw.” And on election day her chance of losing was “about the same as the probability that an NFL kicker misses a 37-yard field goal.”
If you’re not laughing at this, you ought to be crying. These numbers are absurd and the precision they communicate is misleading. As much as I love building mathematical models – and we do make good use of them in our work when appropriate – it is no wonder that the public feels betrayed and our clients roll their eyes when we talk about margins of error.
4. Qualitative is critical. A shortcoming of nearly all surveys is that quantitative research rarely gives us a deep feel for what drives the numbers. This election highlights that more than ever. There will always be disappointed voters and “Don’t Blame Me – I Voted for the Other Guy” bumper stickers but this one seems different. There is genuine disbelief that Trump won and genuine disbelief that so many voters could align with the vision articulated by his campaign.
Unfortunately, survey data doesn’t help much. We know the demographics of who voted for whom and the geographies and economics of where they live. But none of it gives a deeper sense of who, why and how. With the right kind of research, we can and should be saying, “Of course, all of this polling data makes sense.”
Good qualitative research might look like J.D. Vance’s Hillbilly Elegy, which offers a first-person account of “what a social, regional and class decline feels like … for a large segment of this country.” Or it would take a deep sociological approach like Arlie Hochschild’s Strangers in Their Own Land. In Hochschild’s words, “Hidden beneath the right-wing hostility to almost all government intervention … lies an anguishing loss of honor, alienation and engagement in a hidden social class war.”
Marketing research is no different. We are increasingly dazzled by the promise of more and more data, all of it immediately accessible, transformed into insights with newer technologies. We have increasingly sophisticated computational models at our fingertips and with free, open-source software, no less. This election demonstrated how quantitative data can (and will) fall on its face if that is all we do. We need focus groups, in-depth interviews, design labs and ethnographies. We need good, insightful qualitative research or the numbers just won’t make sense.
5. Do it only if it matters. Election polling puzzled me before I started a career in research. It seemed like constantly shifting numbers meant that polling was baloney, or alternatively, that the polls were measuring Jell-O. Either way, who cares? The only election poll that matters is the election itself. Soon enough, we will all know who won, so what is the value of predicting it ahead of time?
From my vantage point today I can think of many reasons that polling might be valuable. If it is commissioned by a campaign for internal use, polling helps candidates understand what matters to voters and how to make their messages resonate. When polling asks about issues beyond picking candidates, it can offer valuable insight that ought to influence public policy. And given that polling works, it can reinforce the validity of elections when losers cry foul, or it can provide evidence of fraud when elections are rigged.
But beyond my professional curiosity and wanting to learn from them as much as I can, I have a hard time seeing much value in the polls we witnessed in the last 12 months. Did they matter? Could we do anything with the results? Are we better off for having that constant view-in-advance of what might happen? I have a hard time even understanding the utility of a mathematical model that aggregates all those polls into an ongoing probability of outcomes. Professionally, all of it is fascinating. Personally, not so much.
Most of us in marketing research are not in the business of election polling. But there is a lesson to be learned. No matter what research or survey work you are doing, ask yourself whether it matters. Specify how it will be used. Identify specific decisions that need to be made. Know in advance how decisions are contingent upon the findings you will report.
If you find yourself scratching your head and can’t specify exactly how the research will be used, then shift your budget to something else so that the research you do will matter.
Fundamentally sound
The most important lesson for marketing research from the 2016 election is that our basic methods of inquiry are fundamentally sound. But we need to be vigilant about who we are measuring and how. We need to triangulate with non-mathematical approaches that help explain the numbers. And we need to think more deeply about what we are doing and why.
However you feel about the confusion of presidential polling and predictions, I hope you have been giving deep thought to the various implications for your research.