Editor's note: Nik Werk is senior research manager at research firm B2B International, White Plains, N.Y.
After years of navigating long PowerPoint decks full of bar charts, decision makers who rely on market research are increasingly putting analysts under pressure to deliver a higher standard of analysis – and rightly so.
The most coherent, memorable and effective medium that analysts have at their disposal is storytelling. In this article I will explain what storytelling is, how it is done and why our brains are hardwired to prefer this level of analysis.
One of the most ingenious observations about the Internet was made in the early 1990s by Gary Kremen. Having spent a significant sum of money on dating hotlines, he saw the potential for online dating when the Internet was still making its way into people’s lives. In 1995, he took a $2,500 advance on his credit card to register the domain, Match.com. In the company’s early phase, it struggled to get off the ground. People were only just starting to go online and were not yet used to online dating. To grow the number of users on the site, he urged all his employees and the people he knew to sign up, including himself and his girlfriend. Things got moving and Match.com reached a large number of users, which made the site the leading online paid dating service, a position it still holds today. In one respect, however, Kremen became the victim of his own success. His girlfriend ended up leaving him – for a guy she met on Match.com.1
Whether you already knew this story or not, there is a significant chance that you will remember the punchline: that his girlfriend left him for a guy she met on his own Web site. You may not remember his name, the advance on his credit card or even the name of the dating site but it is highly probable that you will remember the overall storyline for a long time to come.
The reason for this is neurological. As neuroscientists have discovered, the brain responds with more focus and engagement when we hear stories than facts. At the most basic level, the brain is trained to find the easiest connection between cause and effect, which is what stories enable us to do.2
“The easiest connection” is a key phrase here, because unless facts are tied together as a coherent story, we often struggle to recall different facts, even if they are about the same topic and from the same data set. We better understand and remember information when we can relate it to what we’ve heard or experienced. And we are more likely to remember stories if they are personal or emotional than statements of facts.3 This is why stories are more memorable and why you are likely to remember the overall storyline about Match.com but less likely to remember the details like the year and name of the founder.
So, what does that mean for researchers, who are in the business of collecting and presenting facts? Analysts can and should learn from this and recognize the importance of storytelling over and above a series of charts, figures and facts, which are hard to engage with and almost impossible to remember. To understand what storytelling means in the context of data analysis and research, it is important to understand how it is different from other levels of analysis.
Five levels of data analysis
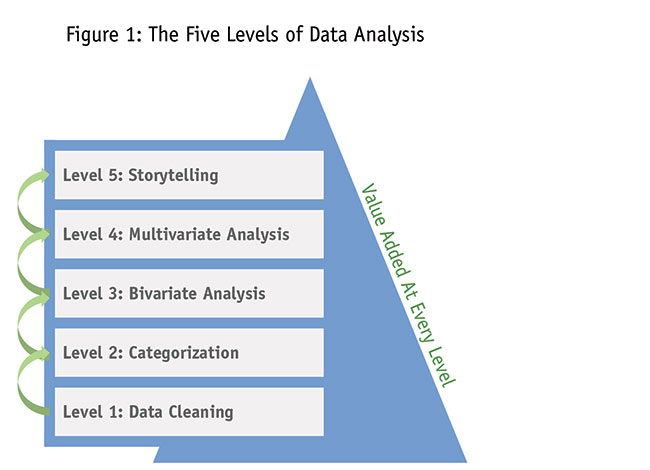
The different ways analysis can add value to a data set can be broken into five levels, each level adding more value to the underlying data set by creating greater clarity or interpretation (Figure 1).

Level 1: Data cleaning
The most basic level of value-adding data analysis is the collation, ordering and/or cleaning of the data. This does not change or interpret the underlying data but makes it more accessible, ordered and easier to work with. It can be as simple as putting various data points into the same list, removing incomplete or faulty data points and sorting it alphabetically.
Level 2: Categorization
The second level of analysis is the categorization of data through coding, grouping or allocation into categories or types. For instance, a set of data points listing U.S. cities could be allocated into groups of states or census regions. Basic thematic analysis could then be conducted based on this categorization only – such as listing the cities in each state.
Level 3: Bivariate analysis
Most research consists of third-level analysis. This is bivariate or pivot analysis conducted by crosstabulation of two data variables within a data set. One variable is analyzed by using another variable as a filter. For instance, a table of population census data could be presented with demographic data such as age bands along one axis (20-29, 30-39, etc.) and U.S. state on the other (Alabama, Alaska, etc.). Then, statistically-significant differences between filtered data points could be calculated and presented, along with analysis to draw attention to noteworthy differences in the demographic makeup of populations in different states. This type of crosstabulation has long been the bread and butter of the research industry, whose deliverables still tend to focus highly on crosstabulated charts or tables. While it remains a useful analytical tool, it is limited to two variables at a time. As a consequence, separate data points and findings are presented independently, often through the medium of an extensive PowerPoint or Excel file.
Level 4: Multivariate analysis
The second-highest level of analysis is multivariate analysis, which is usually used to investigate and explain the relationship between two or more variables. This is different from bivariate analysis because the relationships between the variables themselves are studied, rather than being used simply as filters against each other. This analysis is used to assess and predict relationships between variables, such as customer satisfaction and annual spend in a store. Types of multivariate analysis often conducted in research are: driver analysis (e.g., regression), factor analysis, cluster analysis and correspondence analysis.
Level 5: Storytelling
The highest level of data analysis requires the highest level of skill and also produces the most coherent, memorable and engaging insights about a data set. This level of analysis is called storytelling or story-based analysis. In research and data analysis, it will usually take place after initial analysis is conducted. Initial analysis will usually consist of data cleaning, categorization, bivariate analysis and sometimes also multivariate (referred to as Level 1- 4 analysis earlier). Storytelling usually involves the following four steps (Figure 2).
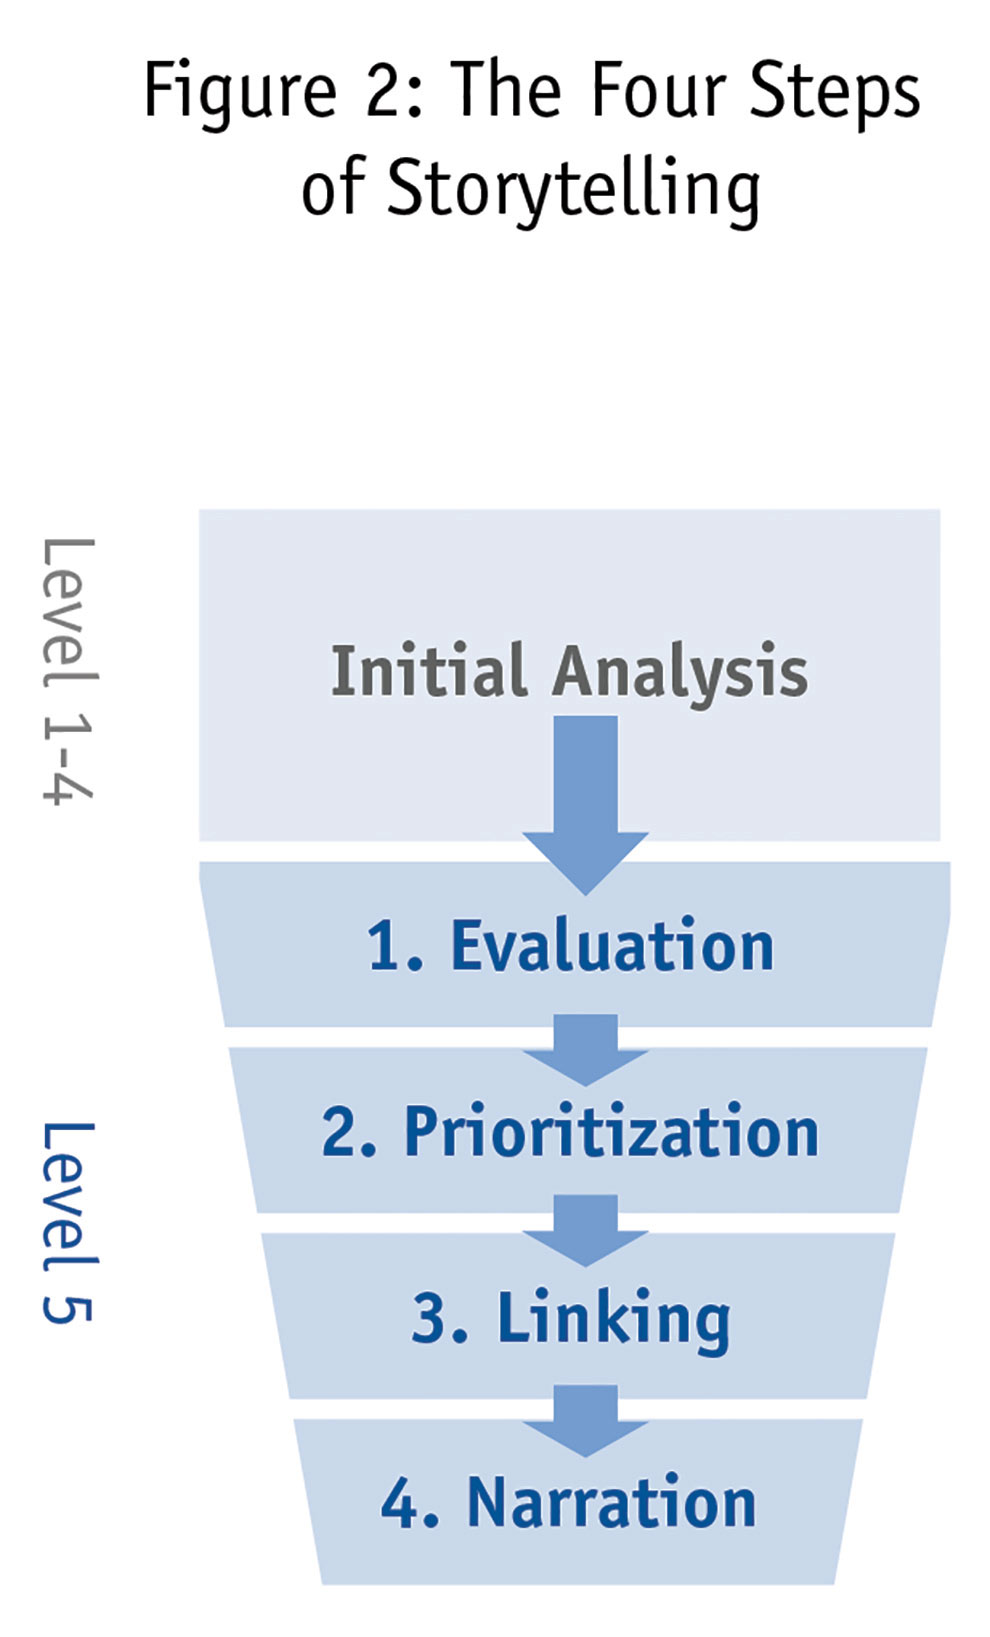
1. Firstly, storytelling analysis requires an evaluation of the relative importance of all variables, drivers and inputs in a data set. It is necessary to conduct prior levels of analysis beforehand, so that all interpretation of the data set and the relationship between variables within it is known.
2. Then follows prioritization of the most important data points and findings across the data set and the analysis. Here, the analyst will prioritize all the important findings from the review of the full data set. The analyst might take note of all the most important insights, judging each on their own merit. Taking the example of a customer satisfaction survey, the overall satisfaction, differences by variables (e.g., gender, age) and drivers of satisfaction might be noted.
3. After the first two steps, storytelling departs from the work usually associated with formulating ordinary conclusions. The third step is the linking of the prioritized key data points and findings into one or more coherent orders and themes that can be communicated as a story.
The analyst will start to focus the prioritization effort on insights that can be linked or related to each other. In this stage, the insights prioritized are judged not just on their own merit but by how well they link together with other important insights. In the example of a customer satisfaction survey, it may be that a series of connections are apparent. There could be a link between older participants who spend more but are less satisfied and value personal service higher. It may also be that the company conducting the survey sees that its digital offering is being noticed and used to a higher extent but mostly by younger participants.
4. The final step is narration, which is the formulation of the story of the linked prioritized findings and data points. This involves finding a common theme, relation and means of transforming the coherent findings into one or more stories.
Using the linked examples from before, the story might be about how this company focused too much on digital offerings, which were not picked up by the older customers who provide significant revenue but have not noticed or benefited from the new digital changes implemented. This story could then be backed up with key data points like statistics and quotes.
Case study: restaurant reviews
This short case study will use a practical example to explain the five levels of analysis. Imagine a data set is available with 2,000 recent verbatim reviews from the Web site of a restaurant. Appended to the data is a score from 1 to 10 on how satisfied people were, their bill total, tip, party size and time/date of visit.
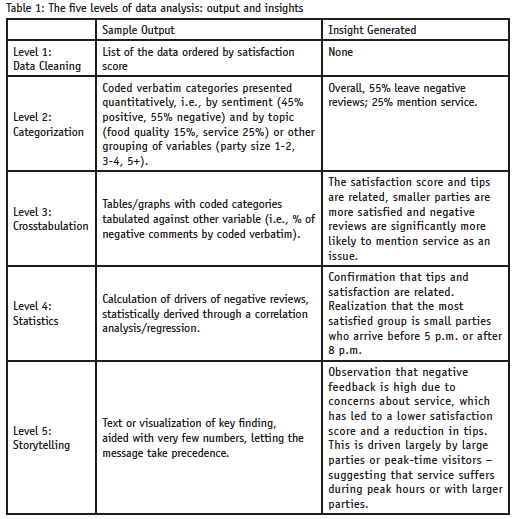
As Table 1 illustrates, the data becomes more meaningful and memorable the higher the level of analysis conducted on the underlying data set. For example, categorization adds a lot of value to the data set but without multivariate analysis, it isn’t able to provide insight about the causes of the negative reviews. Crosstabulation sheds lights on differences and draws out important correlations like lower satisfaction and lower tips; smaller parties link to better reviews and service is related to more negative reviews. Statistical analysis is used in this example to calculate the driver of negative reviews, which makes the findings actionable and establishes the root cause. However, the most useful level of analysis is the story-based analysis, which combines insights about concerns about service from the verbatim comments with input from crosstabulations and the statistical analysis.
Make sense of it
The most important reason to conduct analysis on a data set is to make sense of it. Without clear, evidence-backed analysis, research cannot be used to drive action or change. Yet, an often-cited complaint about research and analysis is that it does not lead to action. A large part of this problem has to do with how the findings are communicated in the first place.
The problem with large research reports filled with charts, tables and bullet points is that very little of the information sticks. Immediately after reading a long report or sitting through a research presentation, people often differ on the interpretation or meaning of the data presented. This makes it harder to prioritize key findings or agree on how to drive action from those findings in the short term. In the long term, the majority of the points made are then forgotten.
Over the last decade, the research sector has increasingly focused on initiatives such as automation and outsourcing of charting and analysis, leading to commoditization of the processes and techniques used to generate market outputs. Storytelling goes against this, because it requires a level of research skill and immersion in the data that makes such outsourcing initiatives unfeasible. Storytelling instead brings back the importance of the skilled researcher as an integral driver of any analysis project. The research sector recognizes this issue and more emphasis is being placed on training and skills to be able to find the story in the data.
Storytelling is also our best method for overcoming the “stickiness” issue. Our brains prefer stories; it’s difficult to recall a series of different facts, even about the same topic, if they are not strongly connected through the medium of a story. By condensing and highlighting key findings from a data set and structuring these in the form of a story the interpretations by the audience will differ less and the findings are more likely to stick in the long term.
Leads with the story
Storytelling is different because the analyst leads with the story itself and then might use insights derived from the data set to back up the story. While the story should always be grounded in the data set from which it is derived, it may be told without direct reference to the underlying data itself. The story itself is the main value-added analysis and its deliverable. By contrast, an analyst who is not using storytelling will usually lead with the data itself and might then verbalize the conclusion that can be drawn from it.
Successful storytelling requires an effective way of succinctly communicating the most important observations and interpretations of the data set. For instance, a data set about sources of air pollution in the U.S. might highlight a wide range of contributors and varying causes. From a closer prioritization of the most important contributors to air pollution and their relationship with each other, it may be that a short story emerges, whereby three sources contribute the most to the issue – vehicles, farmland and coal, accounting for 89 percent. The story of the data set could then be presented with the conclusion that the focus should be on “The three Cs – cars, coal and cattle.”
As the fictional 89 percent illustrates, storytelling requires sacrificing detail for simplicity, while not excluding anything significant. The analyst must therefore understand not just the full data set and the analysis conducted on it but also its context and the subject matter of the data.
Unlike lower levels of analysis, storytelling is complicated because each story is unique to its underlying data set. Bivariate (Level 3) and multivariate analysis (Level 4), for instance, can be sense-checked with statistical significance testing and have outcomes that will be comparable against other data sets and past experience. When we do storytelling, however, we do not know what we will find before we begin the analysis.
Five qualities, in particular, are important in a storytelling analyst:
1. Broad research skills. Storytelling is difficult because it demands a more diverse range of skills than other levels of analysis. It requires a good understanding of research techniques to enable the evaluation and prioritization of the data and the ability to spot patterns across a large set of data and the analysis of that data to help with the linking.
2. Understanding the context. In order to know how to prioritize key findings before linking them together, it is necessary to have a strong understanding of the context of the data set and the market or issue it is derived from. This is particularly the case for technical data sets like those produced in business-to-business research.
3. Time and effort. Storytelling requires the time and effort to review all the initial analysis conducted prior to formulating a story. It is therefore not something that can be automated or done without a skilled and informed researcher.
4. Trust and knowledge. Storytelling is inherently different from Level 1-4 analysis because it is the only method where the analyst does not initially know which data inputs the final story will come from or the format in which it will be expressed. It requires trust and knowledge because the reader has to trust that the analyst has built a robust and insightful story which has not ignored any important insights. It is the researcher’s responsibility to ensure that the story addresses the underlying research need. If the story does not fully address the objectives of the research then it serves no purpose as a means of analysis.
5. A good storyteller. Finally, good storytelling requires a good story-teller.4 One of the world’s best storytellers is the entertainer Penn Jillette. In an interview about his presentation skills with the Harvard Business Review, Jillette recalls blunt advice from a former teacher: “No one cares about what you write or say. They’re looking for any excuse to not read or listen. You have to make sure they don’t have one.”5 The same goes for research presentations whether in person or in writing.
While not every analyst has Jillette’s presentation skills, there are things any analyst can do to improve their storytelling. Neuroscientists have demonstrated how proper use of adjectives and descriptive terms makes for better comprehension and memory of a story,6 rather than stating plain facts. Evidence suggests that stories are most engaging when listeners can draw personal or emotional parallels to the content. Market researchers, who are often rooted in data, need to be more comfortable including analogies, context and anecdotes to bring the story to life.
Hardwired into your brain
What was the name of the founder of the dating site I mentioned at the outset, the amount of his credit card advance and the year the site was launched? If you remember now, you will likely not remember a week from now. However, you will probably still be able to share the story of how a dating site founder’s girlfriend left him for a guy she met on his site.
The reason why you will remember this is hardwired into your brain: storytelling. This is the best medium in the analyst’s toolkit for driving comprehension and action from research findings. By tapping into our natural ability to digest and remember stories where links are easy to spot between cause and effect, storytelling is far more effective than lengthy PowerPoint decks and presentation methods used in research.
As storytelling continues to grow in prominence within the research sector, decision makers of tomorrow will increasingly start to demand a storytelling aspect to their research deliverables. However, storytelling requires a different skill set and follows a different process from the types of analysis which dominate the research profession. It requires more time, as initial levels of research have to be conducted prior to storytelling. It is also a time-consuming process to evaluate, prioritize, link and then add narrative to a large data set with extensive analysis.
Yet when mastered, storytelling offers researchers an opportunity to break through the commoditization of automated chart-heavy reports and deliver insights with far more impact and greater value.
References
1 Kauflin, J. (2011) ”How Match.com’s founder created the world’s biggest dating website – and walked away with just $50,000.” Business Insider, 16th December 2011. businessinsider.com/match-gary-kremen-2011-12; Gelles, D. (2011) “Inside Match.com.” Financial Times Magazine, 29th July 2011. ft.com/intl/cms/s/2/f31cae04-b8ca-11e0-8206-00144feabdc0.html.
2 Monarth, H. (2014) “The irresistible power of storytelling as a strategic business tool.” Harvard Business Review, 11th March 2014. hbr.org/2014/03/the-irresistible-power-of-storytelling-as-a-strategic-business-tool; Zak, P. (2014) “Why your brain loves good storytelling.” Harvard Business Review, 28th October 2014. hbr.org/2014/10/why-your-brain-loves-good-storytelling.
3 Widrich, L. (2012) “The science of storytelling: Why telling a story is the most powerful way to activate our brains.” LifeHacker, 5th December 2012. lifehacker.com/5965703/the-science-of-storytelling-why-telling-a-story-is-the-most-powerful-way-to-activate-our-brains.
4 See also Harrison, M. (2015) b2binternational.com/publications/world-class-market-research-presentations-storytelling/
5 Beard, A. (2016) “Life’s work: An interview with Penn Jillette.” Harvard Business Review, October 2016, https://hbr.org/2016/10/penn-jillette
6 Zak, P. (2013) ”How stories change the brain.” Berkeley University (greatergood.berkeley.edu/article/item/how_stories_change_brain); Paul, A. (2012) “Your brain on fiction.” New York Times, March 17, 2012, nytimes.com/2012/03/18/opinion/sunday/the-neuroscience-of-your-brain-on-fiction.html