Editor's note: Kevin Gray is president of Cannon Gray LLC, a marketing science and analytics consultancy. This article appeared in the September 23, 2013, edition of Quirk's e-newsletter.
Most marketing research is cross-sectional, meaning our data represent one slice in time. However, we also have data collected over many periods, such as weekly sales data for our brands and competitors' brands. This is an example of time series data. Time series analysis is a specialized area of statistics to which many marketing researchers have had limited exposure, despite it having many important applications in MR.
Why is the distinction between cross-sectional and time series analysis important? For several reasons - one being that research objectives are usually different. Another is that most of the statistical methods we learn in college and use in marketing research are intended for cross-sectional data and if we apply them to time series data, results may be misleading. Time is a dimension in the data we need to take into account.
Time series analysis is a complex topic but to put it simply, when we use our usual cross-sectional techniques (e.g., regression) on time series data, one or more of the following outcomes can occur.
- Standard errors can be far off. More often than not, p-values will be too small and variables can appear more significant than they really are.
- Regression coefficients can be seriously biased.
- We do not maximize the information provided by the serial correlation in the data.
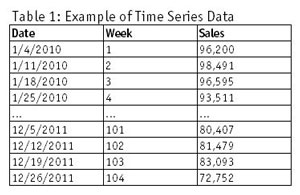
Table 1 shows a simple illustration of what a time series data file looks like. The column labeled "Date" is the date variable and corresponds to a respondent ID in survey research data. "Week," the sequence number of each week, is included because using it (rather than actual date) reduces graph clutter. The sequence number can also serve as a trend variable in certain time series models. In this illustration, "Sales" are the number of units sold each week.

Univariate analysis
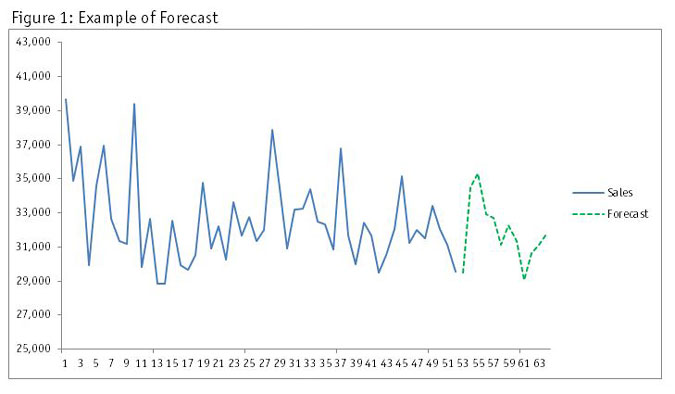
To build on the example in Table 1, a possible objective would be to forecast sales. There are many ways to accomplish this and the most straightforward would be through univariate analysis, in which we basically extrapolate future data from past data. Two popular univariate time series methods are exponential smoothing (e.g., Holt-Winters) and ARIMA (autoregressive integrated moving average). In Figure 1, one year of historical sales data have been used to forecast sales one quarter ahead with an ARIMA model.
Causal modeling
Obviously, there are risks in assuming the future will be like the past but, fortunately, we can also include causal or predictor variables to mitigate these risks. Besides improving the accuracy of our forecasts, another objective may be to understand which marketing activities - ours and competitors' - most influence sales. Causal variables will typically include data such as GRPs and price and also may incorporate data from consumer surveys or exogenous variables such as GDP. These kinds of analyses are called market response or marketing-mix modeling and are a central component of ROI analysis. They can be thought of as key driver analysis for time series data. The findings are often used in simulations to find the optimal marketing mix.
Transfer function models and dynamic regression are two popular approaches to time series causal analysis. Essentially, they refer to specialized regression procedures developed for time series data. There are also more sophisticated methods and I'll highlight a few in just a bit.
Multiple time series
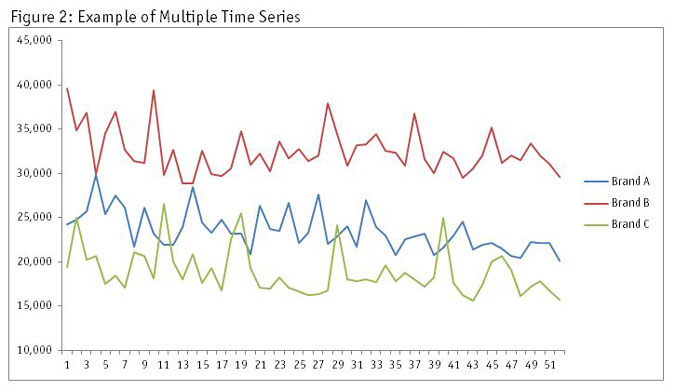
There are situations in which you might prefer to analyze multiple time series simultaneously (e.g., sales of your brands and key competitors). Figure 2 shows weekly sales data for three brands over a one-year period. Since sales movements of brands competing with each other will typically be correlated over time, it often will make sense - and be more statistically rigorous - to include data for all key brands in one model. Vector autoregression (VAR) and the more general state space framework are two frequently-used methods for multiple time series analysis. Causal data can be included and market response/marketing-mix modeling carried out.
Other variations of time series models
There are several additional time series methods relevant to marketing research.
Panel models include cross-sections in a time series analysis. Series for several brands, for instance, can be stacked on top of one another and analyzed simultaneously. Why not use VAR or another multiple time series method instead? We may not have a sufficient number of observations (points in time) for these approaches to be feasible or perhaps we're mainly interested in looking at the product category as a whole.
In some instances, one model will not fit an entire series well because of structural changes within the series and model parameters varying across time. There are numerous breakpoint tests and models (e.g., state space, switching regression) available for these circumstances.
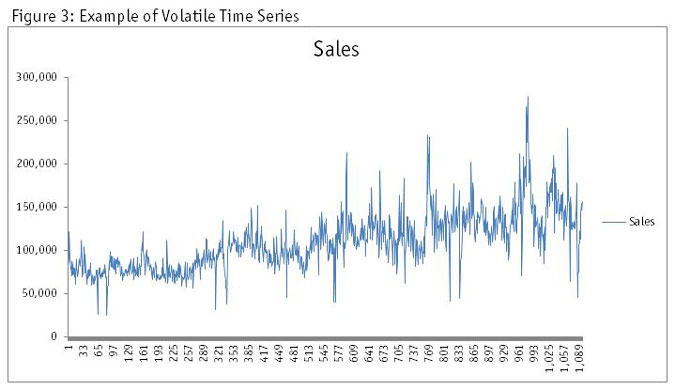
You may also notice that sales, call center activity or other tracked data series exhibit clusters of volatility. That is, there may be periods in which the figures move up and down in a more extreme fashion than other periods and you may not be able to explain why this is happening on the basis of seasonality or other business or economic reasons. Figure 3 illustrates this kind of pattern.
In these cases, there is a class of models under the name of GARCH (generalized autoregressive conditional heteroskedasticity) you might consider. ARCH and GARCH models were originally developed for financial markets but can used for other time series data when volatility is of interest. Volatility can fall into many patterns and accordingly there are many flavors of GARCH models. Causal variables can be included. There are also multivariate extensions for situations in which you have two or more series you wish to analyze jointly.
The methods I've mentioned are time domain techniques and often employed in operations research and econometrics, as well as in marketing research. Another family of methods, known as the frequency domain, plays a more limited role in MR.
Scratched the surface
I've barely scratched the surface of a rich and multifaceted set of topics that are new to many marketing researchers but are more and more becoming an important part of our world. Fortunately for readers wishing to learn more about these methods, there are many excellent introductory textbooks available (e.g., William W.S. Wei), as well as those covering specific topics in depth.