
Tell to sell
Eldaa Daily is senior director, research, at Dynata. She can be reached at eldaa.daily@dynata.com. Charles Young is founder of Ameritest. He can be reached at chuck@ameritest.net.
One way brands can project a premium image is by using high-quality production values in their advertising. That’s why network-quality TV commercials don’t look like homemade YouTube videos or PowerPoint sales presentations.
One common question that comes up in agency discussions about how to do early ad testing research is, “How do we measure the contribution that good production values make to overall ad effectiveness?”
“Production value” is a loosely defined term that could mean everything from the total cost of a video production to the net contributions that different artists make to the overall quality of the final execution: the storytelling, the acting, camera work, set design, music and sound, special effects, film editing and so on.
In this article we’d like to explore the different contributions that well-crafted moviemaking and skillful storytelling make to overall creative quality or ad effectiveness. In the case of the former, high-quality cinematography is key to attracting audience attention, while good storytelling is key to motivating consumer behavior.
Focus on KPIs
Most of the well-established pretesting systems have evolved over the past 30 years to focus on measuring the key performance indicators (KPIs) of attention, branding and motivation or persuasion. These are widely accepted report-card measures of ad effectiveness. And while different research systems measure these performance dimensions in different ways, the best systems have good histories of predicting various in-market tracking or brand lift metrics, such as brand awareness and product price/value perceptions. The ultimate goal being to predict sales performance and advertising ROI.
An interesting trend seen across many pretesting systems is that the attention and motivation measures are both important and generally uncorrelated – that is, they are independent variables that drive ad effectiveness.
From a diagnostic point of view, therefore, our next questions are: What are the creative variables that drive attention-getting power? What other creative variables drive motivation?
To answer these questions, many pretesting services use various rating statements to measure audience reactions to an ad. Respondents self-reporting on their own internal reactions to an ad can be a valuable source of insights into how an ad is working.
For example, at Dynata, by using our Ameritest system, we have found that entertainment, enjoyment, uniqueness and buzzworthiness are highly correlated with an ad’s attention score. In contrast, the relevance and credibility of the message and the relatability of the situation or characters, are the keys to a strong motivation score. Other systems report similar results. But rating statements collectively explain only about half of the overall variability of a video ad’s performance on the key metrics.
Rating statements measure audience thoughts and feelings about an ad when viewed as a whole, or “gestalt,” experience. Something else is needed to get inside a video, measuring the internal dynamics of the video experience in order to provide actionable insights into why an ad performs well or poorly. For that reason, video-testing services currently provide a range of diagnostic moment-by-moment measures – from dial meters to eye tracking to facial response to EEG.
Our system uses three PictureSorts to peel back the different layers of creative quality: Flow of Attention explains attention and branding; Flow of Emotion explains motivation and branding; Flow of Meaning explains communication.
These are also the three keys for explaining and predicting the formation of long-term memories, the final cognitive step in the brand-building process.
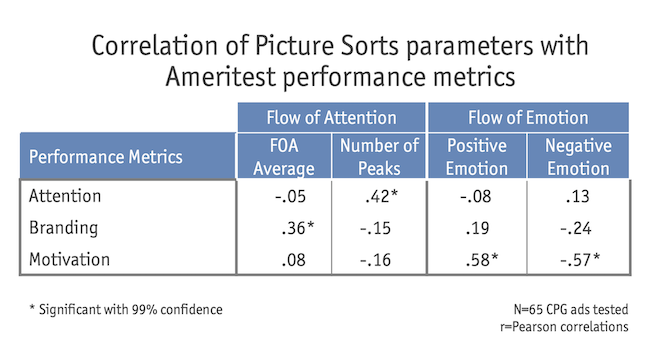 Figure 1 illustrates how PictureSort data is correlated with the KPIs measured by the Ameritest pretesting system. This data came from a large CPG company that tested 65 ads. This collection of ads represents a wide range of executional types – from stand-up presenter to montage, humor to slice-of-life – and not just videos that used a narrative or storytelling format.
Figure 1 shows that the number peak or standout moments in the Flow of Attention graph is significantly correlated with attention scores but is not at all correlated with the motivation scores. Conversely, the Flow of Emotion graph is correlated with motivation but not attention.
This is because capturing audience attention and motivating a sale are both important psychological variables but they are controlled by different mental processes.
Surprising pivots
According to Aristotle, a story must have a beginning, middle and end. Robert McKee, author of a series of best-selling books on writing stories for movies, builds on Aristotle’s plot structure by positing that the elements of a story must include: an inciting incident (beginning); conflict/struggle to reach deepest desire (middle); surprising pivots in the plot (middle); and climax and closure (end).
It is as true now as it was in Shakespeare’s era that actors and writers are important for telling good stories. However, as McKee teaches, “[T]he love of a good story, of terrific characters and a world driven by your passion, courage and creative gifts is not enough. Your goal must be a good story well told.” And if you want to tell a good story using moving pictures, you need to master the art and craft of cinematography. You need somebody like Steven Spielberg in addition to Shakespeare.
Joseph Mascelli wrote the classic work on cinematography: “The Five C’s of Cinematography.” In his book, he shows how the five Cs mirror the human visual perception system:
- composition/framing – field of vision
- camera angle – point of view
- cut – blink/shift in attention
- continuity – coherence of action
- close-up – focus of attention
That’s why watching a movie can be such an immersive experience. When we watch a movie, a TV ad or a web video we allow another mind to control our cinematic consciousness of the world of sight and sound that surrounds us. In the best cases, we allow someone else to direct our attention.
The Flow of Attention measures how the mind processes visual experience into memory. It’s based on a simple recognition test conducted a few minutes or even a few days after respondents have seen a video. Statistically, it measures the probability that any given image in a video will be remembered by the audience.
The Flow of Attention measures the rhythms of visual communication. As an audience watches a video, their minds sort images into long-term memory the same way you sort through your e-mail every morning as you decide which ones are important or not. The Flow of Attention reveals the ebb and flow of audience attention as each mind rapidly sorts through the stream of images flowing from a video.
Analyzing how the mind processes a movie is, in many ways, similar to the process of analyzing a piece of music. Like music, and like any other language, good movies rely on structure or form for clear communication. Well-crafted visual syntax and grammar in the visual language of film is important for controlling audience attention.
To predict whether a given video will be attention-getting, therefore, we must analyze the shape and the image content of this visual processing curve. This structural analysis of how well a video works as a piece of film is just as important in explaining a high or low attention score as having a unique, entertaining idea is.
An interesting characteristic of the Flow of Attention graph is that it really doesn’t matter who is in the audience. We learned early on, from testing the same commercial in multiple countries for global clients, that the Flow of Attention graph for a video is consistent across countries, or even when comparing one target audience to another. That’s because Hollywood has taught the whole world how to watch movies in the same way.
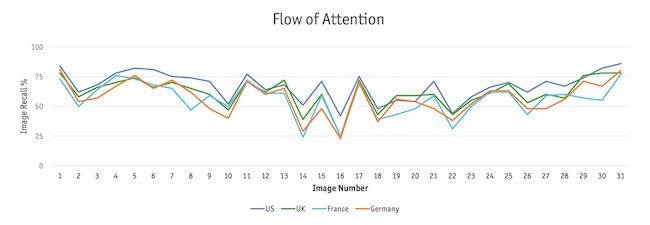 If you look at the Flow of Attention line graph in Figure 2, you can see the results for one ad tested in four countries. As you can see, there is little variation from country to country despite strong cultural differences across these audiences.
From this, and hundreds of other similar tests, we have concluded that the Flow of Attention is measuring a universal property of the mind – how the working memory system in the brain processes the images in movies.
In contrast, the Flow of Emotion measures a different dimension of advertising engagement – emotional response, not attention or memory. This second PictureSort is based on sorting pictures into different categories, both positive and negative, which tells us how each respondent felt as they watched each image in the video.
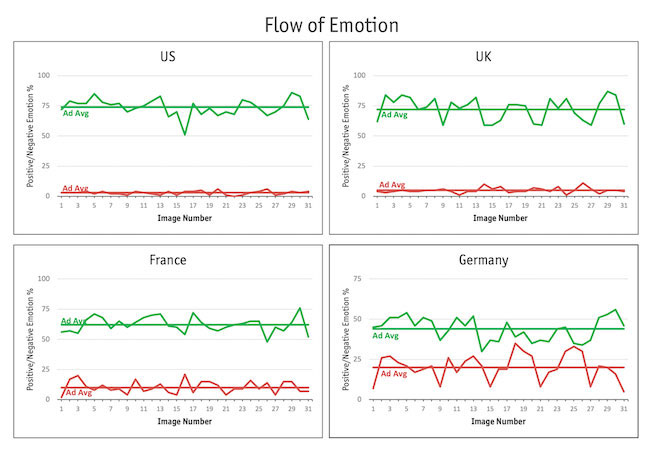 The Flow of Emotion graph in Figure 3 is for the same test ad across the same countries. In these cases we now see a considerable amount of variation in audience response. The main reason for this is that the images in these ads have been filtered through three different cultural lenses, which produces strong differences in audience emotional response. (We should note that strong differences in cross-country emotional responses remain even after adjusting for differences in how different cultures use rating scales.)
Because of the different cognitive processes involved in controlling attention versus those involved in controlling emotions, there is little correlation between the Flow of Attention and Flow of Emotion graphs – just as there is a low correlation between attention scores and motivation scores.
While great stories will sometimes express universal themes of the human condition, in fact most storytelling – particularly ad stories – are quite local in their context and culturally dependent in their meaning. Stories typically teach us how to live in our everyday society, in our time and in our place.
So, it’s important for audiences to identify with the characters and relate to the situations depicted in a video. That’s the reason why Akira Kurosawa’s “Seven Samurai” was remade in America as “The Magnificent Seven.” And it’s the reason Hollywood remakes hit movie stories from one generation to another, with a younger, more relatable cast of actors.
Case study: VW’s Super Bowl ad
“The Force” is the commercial that introduced America to the new Volkswagen Passat a decade ago and is one of the most famous Super Bowl ads. For this reason, just about every pretesting company then in business tested the 60-second launch ad, so that the results obtained by different research approaches could be easily compared to the analysis that follows.
In the ad, we see a child wearing a Darth Vader costume trying in vain to use the Force on several things throughout the day – the family dog, a lunch plate, a toy doll. When dad pulls up in the driveway the boy runs outside and tries again to use the Force on the car. After the first attempt fails, the car starts up, much to the boy’s delight and amazement. We then see a shot of dad clicking the remote-start button on the car’s key fob from inside the kitchen.
One of the nice things about this case study is that the commercial contained no dialogue or voiceovers – just Star Wars music and a price card at the end. It’s an excellent example of pure cinematic storytelling.
“The Force” generated a lot of brand awareness – and sold a lot of cars. In the Ameritest system the commercial scored in the 99th percentile of attention scores and scored nearly double the category average on motivation.
Part of the high attention score came from the positive reaction to the creative concept as a whole. The surveyed audience found the commercial entertaining, unique and relatable and they wanted to talk about it after it was over. The high motivation score stemmed in part from the ad’s relevant message, newsworthiness and credibility. But the positive reactions to the overall concept and message were not the only things at work in the ad’s success.
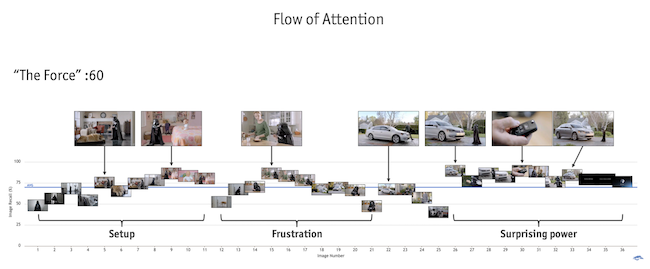 Visually, you can see how audience attention flowed through the ad in Figure 4. In a Flow of Attention graph, the height of each picture gives the probability that image will be remembered a few minutes, or even days, after watching the ad. It reflects the output of the rhythmic cognitive cycles of perception that control attention, as our working memory system processes experience into long term memory storage.
The graph deliberately resembles notes of music plotted on a staff of written sheet music because working memory processes moving pictures and sounds in a similar way. It’s the same cognitive system that integrates the images and music in a piece of film – which is why we see these “waves” of attention. It’s also why we rarely watch movies without sound – the immersive effect of the film would be subverted.
With the attention graph, analysis focuses on the shape of the curve and content of the pictures. The absolute height of the curve is not a variable needed to predict attention scores.
For an ad to break through to a target audience it faces three cinematic challenges related to audience attention: grab it, hold it, focus it.
If you look at the first third of the graph for “The Force,” you can see a rapid build in attention as the execution grabs the audience and draws it in. The Star Wars music certainly plays a dominant chord in the opening sequence. It calls out to the target audience as the “Star Wars generation” – the age cohort that was then entering its peak family-car buying years. And the opening visuals trigger a double take – “That’s not Darth Vader, that’s a small child dressed as Darth Vader. What’s going on?”
The audience quickly begins to understand that Little Darth is on a quest for the Force or power. This idea is shown, in increasing steps of memorability, as the audience figures out that the child is determined to gain power – over the exercise machine, the family dog and the baby doll on the bed.
In the second movement, audience attention continues to engage as they watch his frustration and disappointment about having no power in his life. The mother in the kitchen tries to be supportive by “forcefully” sliding the sandwich plate over to Darth. It doesn’t help.
Finally, in the climactic third movement, the brand arrives in the form of a new car pulling into the driveway, the well-dressed father coming into the house. It’s during this part that the least remembered image in the ad occurs: an interior shot of the dashboard, taken from the driver’s point of view. This image doesn’t fit the narrative up until now and so breaks the visual continuity in the flow of audience thoughts and expectations and thus is ignored.
Little Darth dashes past his dad to see if he has found a new source for power in his life. And this time he does – as the car roars to life at Little Darth’s command! The camera then shifts the point of view to the father and mother standing at the kitchen window watching, and with a closeup of a key, pulls back the magician’s curtain to reveal that the father started the car remotely.
And so, at the peak moment of audience attention, we see the payoff image – the reaction shot of Little Darth’s surprise at the awesome power he has just gained control of.
The movie closes with black title cards announcing “The all new 2012 Passat” “Coming soon” “Starting around $20,000” “Das Auto.” And ends with the VW logo.
The Flow of Attention shows us what visual information audience attention is focused on as they watch this video. In addition to showing us if the visual structure supports the ad’s attention-getting power, this diagnostic information can be used for creating additional content. This information can help edit a video when creating shorter versions or can identify memorable images that can be used as thumbnails or be used as static images in digital display ads, out-of-home or print.
In contrast to the art of cinematography, storytelling is the art of using the language of any medium of communication to shape the emotions of an audience. Controlling attention is important only insofar as it allows the storyteller to control the emotions (and implicitly the behaviors) of the target audience.
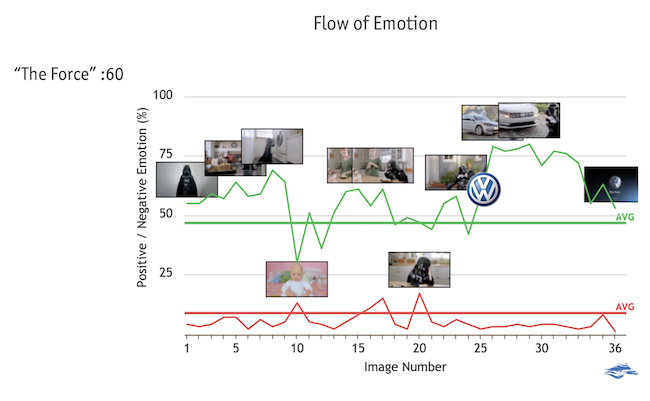 In Figure 5 we can see how strongly the audience responded to the imagery in “The Force.”
Emotion graphs are interpreted in a different way from attention graphs. Analysis should be focused on the height of the emotion graph, which measures the intensity of self-reported response, and not the probability of remembering. As in calculus, the total emotional response to the whole video can be determined by calculating the area under the emotion curve.
Moreover, in analyzing the dramatic structure of the film, one should look at both positive and negative responses. As McKee writes, “Conflict is to storytelling as sound is to music.”
Good stories require struggle and surprise to be effective at moving people. In the case of negative responses, the important question to ask is, “Is the negative emotion evoked at this point of the story intentional, by creative design, or is it unintended?”
For the first two thirds of “The Force” positive audience emotions are engaged at high levels by the action in the story, with small background notes of negativity as the audience empathizes with the frustrations and disappointments of Little Darth. These touches of negativity are there by design. Then, with the arrival of the brand, audience emotions take a quantum jump to a much higher positive level as the story reaches its climax and payoff.
According to the third sort (not shown), the Flow of Meaning, the arrival of the new car is the pivot of the story. It triggers a phase transition in the audience’s mental state – from thoughts and feelings focused on Little Darth’s determination and desire, blocked by disappointment and frustration – which then turns to the positive with Little Darth’s excitement and inspiration, sparked by the arrival of this new potential source of power, which is the final object of his quest.
Finally, we need to ask, “How did the thoughts and feelings evoked by this story impact consumer intentions to at least consider buying a new Volkswagen Passat?” And more generally, “What did this ad do to enhance perceptions of the brand?”
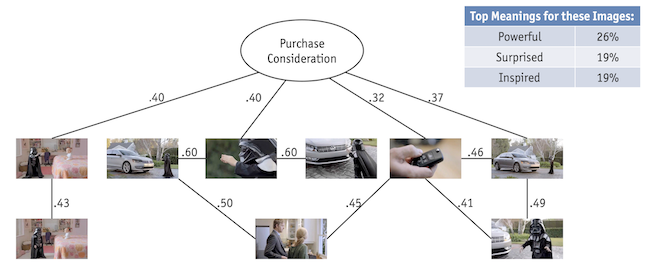 We can answer this by looking at Figure 6, which shows a simple model of the drivers of purchase consideration that we construct by examining the correlations across the various levels of attention and emotional response to the images in the ad. We call these memory maps, which are like the Bayesian networks used in machine learning.
(For more information about memory maps you can read a March/April 2021 Quirk’s article about cross-channel testing called “Plotting the powerful pathways: The value of mapping brand memories.”)
This well-remembered set of six images, all significantly correlated with purchase consideration, represent the heart of the story. What do they tell us about why was this commercial so effective at selling cars?
Consider this analogy: If you want to appear “cool” to other people, you cannot just say you’re cool – because if you say it, then by definition you’re not cool. Similarly, given its historical brand positioning, Volkswagen could not believably claim that its new car was “powerful.” So the brand had to show it.
And so, by understanding how cinematography and storytelling each work, we can split apart the different cognitive processes that determine how attention and emotion work together to drive advertising performance and build branded memories.