
Plotting the powerful pathways
Editor's note: Charles Young is founder and CEO of research firm Ameritest. Eldaa Daly is the firm’s research director. Russ Turpin is associate research director.
 At the dawn of the internet age, when IBM was spending $500 million a year on global advertising to prepare the way for e-commerce, it fired its 40 advertising agencies and consolidated all of its creative work in one agency, Ogilvy. The reason? So IBM would speak with “one voice” around the world. The result was the famous “Blue Letterbox” campaign.
It was a dramatic commitment to the idea of integrated market communications.
What IBM recognized, and many good marketers know, is that when ads work in concert they can leverage existing brand awareness and perceptions and yield increased value. This is why marketers invest in creating a common look and feel across advertising and communication, with standardized fonts, color palettes, logos, trade characters, celebrity spokespersons and other recurring executional elements. The resulting synergies have the potential for long-lasting returns for the advertising investment.
However, in today’s era of multichannel advertising and microtargeting, it can be more challenging than ever for a brand to effectively communicate a unified, integrated strategy. With a confusing array of media options available, marketers need a more complete approach to understanding the effectiveness of multifaceted advertising. And yet most creative pre-testing is done at the level of individual ads. The question for ad researchers, therefore, is how do we understand and measure, particularly in advance, how multiple ads work together to build a brand?
The answer lies in looking where it all comes together, inside the head of the consumer.
Somehow link back
Brand fit is a branding measure frequently used in pre-testing and tracking. It’s a simple rating that has been highly validated to in-market sales results. But what do we mean by the concept of fit? Fit implies that the ideas, images and emotions created by new advertising somehow link back to an existing network of brand associations. These associations are the connected memories that form the idea of a brand in the mind of the consumer. The term fit further suggests that there is shape and structure to this memory network; new memories created by new advertising fit like puzzle pieces into the existing pattern of brand associations, images and feelings.
The existing network of brand memories anchors the brand positioning. However, to keep a brand relevant to ever-changing culture it needs to be continuously nourished with fresh, emotion-charged imagery from new creative. In essence, new ads should add growth rings to the brand tree rooted and growing in memory. That is the creative tension that exists between a brand’s positioning and a brand’s image, between messaging and emotional experience.
From the standpoint of creative content, each new execution can nourish the brand tree in two ways. Like the concepts of frequency and reach in media planning, an ad can either add depth or it can widen the breadth of a brand’s appeal. An ad can increase a brand’s depth by reinforcing or strengthening current perceptions and emotions among existing customers, thereby reinforcing or strengthening their loyalty; whereas expanding breadth means appealing to new consumer segments with different executions.
Layers of memory
Because brands actually exist in consumers’ memories, it’s helpful to have a general understanding of the different layers of memory operating in the consumer’s mind (see Figure 1).
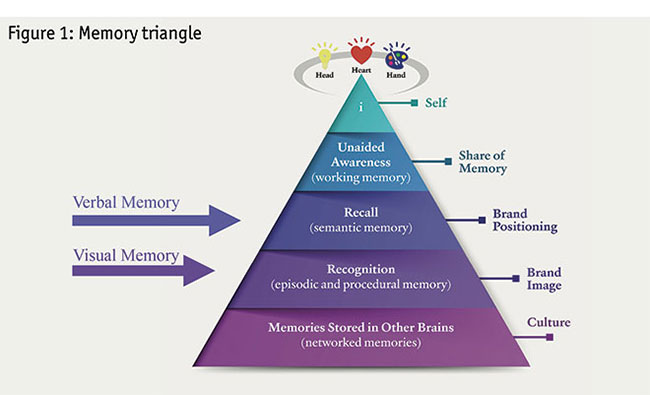
At the top is working memory. Working memory determines how your conscious mind continuously perceives and understands the world. Brands that are easily retrieved or are available to working memory in a product category are the ones most likely to be in that consumer’s purchase consideration set. Brands that come to mind first or spontaneously are default purchase choices – they are on the consumer’s mental shortlist.
Classical measures of working memory from tracking studies, such as top-of-mind awareness (for category leaders) and unaided awareness (for established brands), have been validated over and over again as highly correlated with short-term sales results and are good month-by-month measures of how well a brand’s advertising is doing this job.
The next level down is the semantic memory system where verbal concepts and thought categories are stored. A brand’s positioning, which is the memory of how a brand is conceptually different from or similar to competitors, resides in semantic memory. Semantic memory is the realm of strategic ideas, of features and benefits, unique selling propositions and rational value calculations. For a brand, these perceptions are measured easily with brand ratings and scales.
Episodic and procedural memory are the two non-verbal memory systems on the next level. These systems store our social and physical experiences and their associated emotions and sensations. This is the level of a brand’s image. Hard-headed businesspeople sometimes consider this to be the “soft” side of a brand – but’s that’s because the contents of non-verbal memory are more difficult to measure or quantify – until now.
The episodic memory system is our storytelling brain. It stores the emotions linked to the long-term memories of our life stories. This helps us navigate the complex social world by providing emotional cues that let us know who to trust, who to aspire to be like or how to behave in different social situations. Episodic memories tied to a brand can mean a brand generates a pleasant feeling such as childhood memories or nostalgia or fun or a feeling of luxury or hipness.
The procedural system stores our physical memories, helping us navigate the physical world. The cool sensation of a York Peppermint Patty that you can associate with the image in an ad is stored in procedural memory. Procedural memory is the level at which dance, design and music operate.
And at the bottom level of memory are our networked memories – the human “cloud.” These are memories that we share with others, those that bind us together into a common culture. Advertising exists in context, such as the cultural context in which it’s placed. Understanding how a brand fits within the cultural memories associated with specific media, such as popular TV shows, can help media companies more effectively place advertising.
Brand memory maps
In order to explore how brand memories are networked together, at both the verbal level of brand positioning and the non-verbal level of brand image, we are introducing a research method called brand memory maps.
These maps can be constructed with a simple, algorithmic process that can be done by any ad researcher on an Excel spreadsheet – with a little creativity added for the intuitive display of visual data. (Details on how to construct these memory networks can be found in Chapter 13 from The Advertising Research Handbook, which can be downloaded for free at www.ameritest.com.)
Brand memory maps are useful for identifying:
- the key conceptual nodes that anchor the motivating core of a brand’s positioning;
- the key selling pathways for differentiating the brand’s positioning, for use in creative strategy development;
- the most salient advertising images that drive top-of-mind and unaided brand awareness, helping develop attention-getting executions that drive short-term sales;
- the attachment nodes – brand-linked memories or “advertising equities” – images that recur across different executions that are key for fitting new creative experiences into the existing memory network that represents the brand in the mind of the consumer;
- the branches of the memory network that are better, or less well-developed, for different target consumer segment;
- how memories created by an ad are linked to the memories created by the media it’s embedded in.
Mapping verbal memory
Researchers can map semantic perceptions of the brand across ideas operating in its category with verbal brand ratings scores and correlating these with purchase intent. In the graphic representation (which you can see in Figures 2a and b), purchase intent is the node at the top of the map. Brand perceptions are the other nodes. Lines connect the nodes based on the correlations between these verbal ideas, representing the distance between these ideas in the mind. Each node’s position and the line’s thickness are dictated by the strength of the correlations. Perceptions highly correlated with motivation will be closer to purchase intent and will have thicker lines. Those with weaker correlations will be further away and the lines will be thinner.
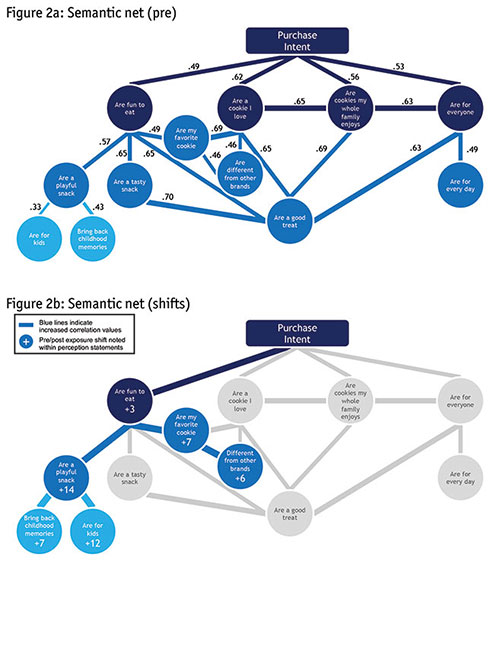
When you look at the entire semantic net, you can literally see how consumers think about your brand and how these ideas are networked together for different selling propositions. This can be used to design communication strategies that have a clear entry point to existing perceptions and a path to purchase intent.
Mapping visual memory
Maps of visual memory networks are constructed from the same iterative, mathematical process as used for mapping semantic memory networks, only it is done with picture-based measures rather than verbal rating statements. Using individual pictures from advertising, visual memory networks can be constructed from consumers’ response to the pictures in terms of memorability, emotion and brand fit. Images replace the verbal nodes and a composite of image memorability/emotional response scores is used for correlations, which represent the emotional distance between images in memory. The result is a visual memory map (Figure 3).
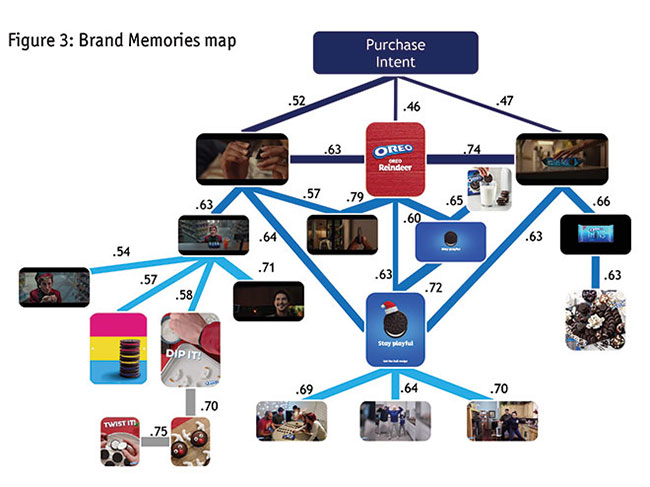
This map shows how a brand’s advertising imagery is linked together in associative memory. It provides a picture of the non-verbal domain of episodic and procedural memory, which is where brand emotions are stored.
Combining these two maps, the verbal and the non-verbal, brand positioning and brand image, gives the marketing team a more balanced – and quantified – view of how advertising builds a brand in consumer memory.
Case study: Oreo cookies
(Note: the data for this study was collected for educational purposes and was not commissioned by the Oreo brand.)
As Christmas approached at the end of last year, we used our standard campaign testing methodology to measure the impact of a group of eight Oreo ads from TV, Facebook and Instagram, from several overlapping Oreo campaigns. We conducted an online survey of 500 consumers who each saw all eight ads (in randomized order). Respondents then answered a series of verbal questions about the Oreo brand and each of the eight executions. This data was used to collect the verbal memory maps. Next, respondents sorted through a randomized subset of 78 still images taken from all the ads – on the three dimensions of memorability, emotion and fit with the brand. This image data was used to build the visual memory map.
Breadth and depth of appeal
In terms of the collective impact of the ads, the breadth of appeal of these eight ads – that is, the percentage of consumers motivated by any of the ads – was 64% on the basis of top-box purchase intent. In terms of depth of appeal, the average number of ads respondents found motivating was 2.6 out of the eight ads.
From this we concluded that the marketing effect of this group of ads was to increase the mental availability of the brand across a large number of consumer segments, keeping Oreos top-of-mind and not to deepen the brand preference during any particular target segment.
Reinforcing brand positioning
The semantic memory network shown in Figure 2a is based on measures collected before consumers saw the ads and is the baseline. The numbers next to the lines are the correlations between conceptual categories.
From this we see that the key verbal concepts anchoring the Oreo brand positioning – those ideas most correlated with purchase intent – are: fun to eat; a cookie I love; cookies my whole family enjoys; for everyone.
Generally, in analyzing brand semantic nets for a product category, ideas closest to purchase intent are cost-of-entry benefits for the category. The perceptions connected to these, on the perimeter of the map, tend to be the brand differentiators. But on the Oreos map, the ideas of “fun” and “love” are primary drivers of purchase intent, which tells us that consumers buy Oreo cookies for emotional, rather than rational reasons.
Another important insight comes from the close association between “fun” and “playful,” which makes these two ideas appear synonymous. But this is not the case. Though the two perceptions are closely correlated, on pre-measures 52% of cookie eaters rate Oreos as fun, while only 39% rate them as playful before seeing these ads.
The semantic network in Figure 2b shows how these ideas shifted in memory after consumers saw the ads. The numbers shown are pre-post increases in brand ratings. The increase in Oreos as a “playful snack” shows how well the ads work together to communicate the idea of playfulness. Because playful and fun are closely linked, the playful messaging of these eight ads increases motivation among consumers who find Oreos fun, resulting in a stronger correlation between fun and purchase intent. Thus, we conclude that collectively these eight ads reinforce the path-to-purchase between playful and purchase intent.
Refreshing the brand image
As we move from the head (semantic memory) to the heart (episodic memory) and hand (procedural memory), we move into the two memory systems where the emotions and physical sensations associated with a brand are stored. This is the realm of execution, not strategy; of brand image, not brand positioning.
Across the entire set of 78 images, 53% of respondents say the images “fit the way I already think and feel about Oreos,” while 28% of respondents say the images “gave me a new idea or feeling toward Oreos and I can see how they fit Oreos.” In other words, the images stretched roughly a quarter of consumers’ thoughts and feelings about the brand in a meaningful way, adding a new growth ring to the Oreo tree of memory.
On the other hand, 19% of respondents say the images “did not fit Oreos” – and therefore, represented a disconnect from the network of preexisting brand memories. This suggests an opportunity to further explore different consumer segments who may have different associations with the Oreo brand in their memories.
The subset of images shown in the visual memory map in Figure 3 are those that were most important for driving short-term unaided awareness of the brand, peak images powering attention and unaided awareness – but also the images that fit the brand – those most likely to be added in long-term memory to the Oreos brand image and thus contribute to long-term sales results as well.
In particular, the subset of images shown in this memory network represents: standout images from short-term memory; highly charged with emotion; fit within the brand’s positioning.
What we see in this visual map, for example, are some “social” images from a Christmas TV commercial showing an elf in a convenience store buying Oreos and a family gathered around a table playing a “game of Oreos.” But many of the “action” images are from the social media ads that briefly but strongly reinforce the idea that Oreos are cookies you can play with in your hands – you can twist them apart, you can dunk them in milk, you can make a reindeer out of them.
The brand team clearly understands the play value of Oreos, which is why most of the ads focused on that idea. They also understand the importance of the twist and dunk-in-milk shots, which is why these images recur across many Oreos ads – familiar tropes that become attachment points (in procedural memory) for linking new executions to preexisting consumer memories.
One might wonder where the rest of the images from these ads went? They are submerged even more deeply in memory, in the network of visual experiences.
Like a map of the U.S.
The memory maps shown here are like a map of the U.S. showing only the interstate highway system connecting the major cities. They leave out the many secondary roads connecting the towns and villages in the memory network formed by a brand’s advertising.
Combing the strategic insights from the verbal semantic memory map with the executional insights from the visual map can more clearly reveal hidden brand meanings. Given how complex these maps can be individually, merely combining them into a single map can be confusing. So, in order to interrogate the complex dataset represented in these maps, a different, more interactive approach is needed.
Imagine that instead of looking at these maps on a static page you were looking at the verbal memory map on an interactive touch screen. To find the five images most associated with “playful snack,” you push the “playful snack” button and see the associated imagery, as shown in Figure 4a. To see images with the closest ties to “different from other brands of cookies,” you push that button and see the answers shown in Figure 4b. These images may become candidates to add as the visual inputs to your creative brief to make the marketing mission more intuitive to creatives.
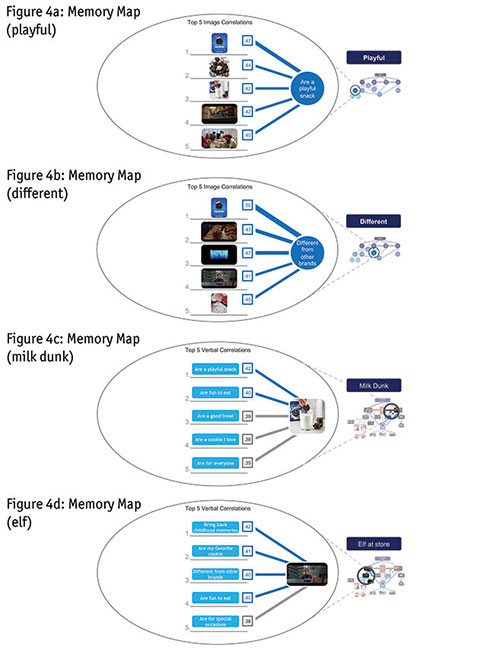
On the other hand, to learn what the iconic Oreo milk-dunk shot means in a strategic sense, switch to the visual map and click on the milk-dunk image – and see the answer in Figure 4c. To see what the Christmas elf in the convenience store means, click on the picture of the elf in the visual map (Figure 4d.)
Together, the verbal and visual brand maps give marketers a balanced view of the brand-building effects of a working set of ads – quantifying how both the verbal and the visual, the rational strategy and emotional executional components of a brand each contribute to purchase intent, and to brand equity.
To summarize, let’s revise a familiar adage: Not only is one picture worth a thousand words but also one word is worth a thousand pictures.
Great, undiscovered country
As Nobel Laureate Daniel Kahneman in his book “Thinking, Fast and Slow,” points out, “The remembering self is sometimes wrong, but it is the one that keeps score ... it is the one that makes decisions.” Branded memory remains the great, undiscovered country of advertising and brand research. It is time we started to map it.