Editor’s note: Ted Saunders is digital solutions manager at research firm MaritzCX, St. Louis. This is an edited version of a post that originally appeared here under the title, “Talk to the hand: New approaches in Web survey design.” The author would like to credit Research Now and Focus Vision’s roles as data collection partners for this article.
June 29, 2007 changed the CX industry. Any guess as to the product introduced? There is a good chance woke you up this morning. It’s probably in your presence right now and you might even be reading this blog post on it. Steve Jobs released of the first iPhone to the world just over 10 years ago. It’s tough to believe it’s been that long since the smartphone was unveiled and, at the same time, difficult to remember how we ever lived our lives without a small computer in our pocket.
Smartphone and customer experience
Mobile devices have impacted the CX industry in many ways, including new digital experiences that now impact consumers. Web sites and apps have become the new storefronts for many companies and are often the first place people go to learn about products and services.
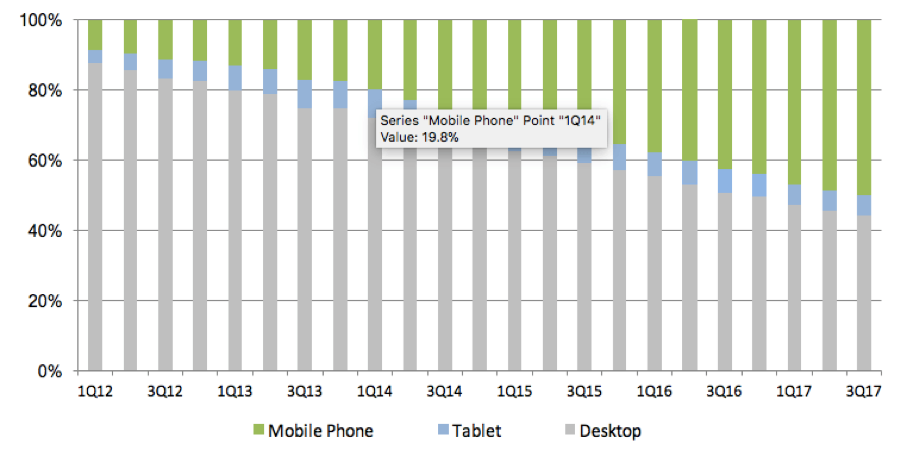
In a blog and joint Webinar with Protiviti in September, my team addressed the need for companies to incorporate digital channel measurement and management into their CX program. Another way that the mobile culture has impacted the CX industry, and the focus of this blog post, is the impact of mobile on consumers when they provide feedback. Web surveys were designed for big browser devices and in 2007 all respondents used their desktops and laptops to complete surveys. Smartphones changed consumer expectations. People started using the browser on their phone to surf Web sites and then used mobile e-mail clients to read their e-mail. As experiences improved consumers began using their phones more and more for activities typically reserved for big browser devices including customer satisfaction surveys. This group of tech-savvy survey respondents, initially referred to as “unintentional mobile respondents,” now make up most all stats. The chart below visualizes the growth in our mobile survey starts over the past five plus years. As you can see, mobile devices now account for 56 percent of all survey starts with 50 percent of all starts on mobile phones and another 6 percent started on tablets.

Challenges on mobile
Respondents face many challenges when taking surveys designed for big browsers on mobile devices. The extent of the problems encountered can relate to the programming standards applied and the types of questions being presented. For the respondent, poor survey displays result in fatigue, higher abandon rates and a poor image of the brand commissioning the research. Researchers face data quality issues when questions do not display as intended on the mobile screen along with fewer data points due to higher question non-response and higher survey abandon rates. There is no shortage of information and best practices to share on this topic so I would like to focus on one of our recent studies.
Inherent challenges
Our testing has determined that even when surveys have been fully optimized – following programing standards to display the appropriate font size for the device and using questions that display well across devices – there are still challenges mobile respondents face since they are mobile. For example, mobile respondents abandon surveys at a greater rate as survey length increases than non-mobile respondents. Due to being on the move, respondents can be more easily pulled away from the survey. They could be on a train and pull up to their stop or they may be at a restaurant waiting for food that has arrived. Another mobile-related challenge involves the design of a mobile phone. Mobile keyboards are much smaller than standard keyboards and most use a touch screen. Having such keyboards typically leads to 20-to-40 percent fewer responses to non-forced open-end questions when compared to responses to the same questions from non-mobile respondents. Furthermore, those mobile respondents who do offer a response provide less commentary, 10-to-20 percent fewer words or characters on average.
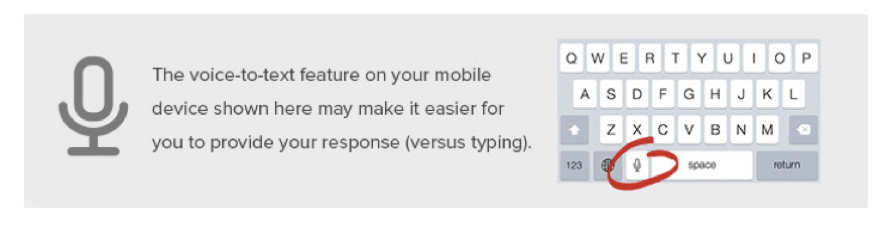
To address the problem of fewer responses on open-end questions (which will increasingly become an issue for companies that value verbatim feedback as more respondents choose to use mobile devices), we decided to focus on unique features of mobile devices, prompting respondents to use the voice-to-text feature on their phone. The voice-to-text feature is available on most newer mobile operating systems and allows tablet and smartphone users to click on the microphone at the base of their keyboard to enable audio transcription from their phone. It allows the user to speak their response and have it transcribed to text, avoiding the mobile keyboard.
Testing voice-to-text
MaritzCX along with data collection partners FocusVision and Research Now first tested the voice-to-text feature in a mobile research-on-research project in April of 2014. At that time, less than 3 percent of mobile survey respondents were using the feature without being prompted. Our 2014 test also indicated that most respondents who were prompted to use voice-to-text did not like the feature, with only 36 percent of the test group indicating a willingness to use the feature in the future. We believe this low rate was partially attributable to 25 percent of those who attempted to use the voice-to-text feature being forced to make a correction due to an error in transcription.
By monitoring voice-to-text technology over time, we’ve noted differences in the way the feature works. When we first conducted the research, users would wait for the device the provide the transcription, going back into the text field to identify and errors and make corrections. Operating system upgrades to iOS and Android platforms now capture text word-for-word as the response is provided. This upgrade, along with increased general use of the feature and the expectation that the accuracy of transcription may have improved, warranted another test.
Repeating the test
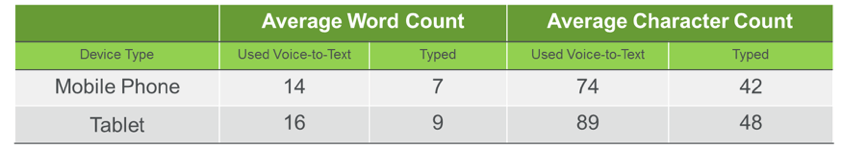
In August of 2016 MaritzCX, FocusVision and Research Now repeated the same test and saw an increase in unprompted use of voice-to-text, with 7.2 percent of smartphone respondents and 8.5 percent of tablet respondents using the feature without being prompted. Those who were prompted to use the feature still ran into some issues with transcription with roughly 25 percent of those using voice-to-text being forced to make a change – the same rate as experienced in April of 2014. Despite the high percentage of transcription errors, over 50 percent of respondents in the text group indicated that they would be willing to use the voice-to-text feature in the future and, in a follow-up open-end response, many indicated that the prompt provided a “cool” factor to their survey experience and others also indicated that they use the feature outside of surveys. Some who use voice-to-text outside of surveys appreciated the prompt to remind them to use the feature as a typing alternative. The main benefit of voice-to-text came across in the quality of response that is displayed in the chart below.
Given the increase in use of the feature, respondent interest in being prompted, anticipated improvements in the accuracy of transcription over time and the improvement in quality of response, using voice-to-text prompts in your surveys should be strongly considered. As our lives become increasingly digital and artificial intelligence becomes more advanced, using voice-to-text will become easier to use and more convenient.
Future challenges and solutions
As technology and customer expectations continue to evolve there will undoubtedly be additional challenges and solutions and we will continue testing new approaches to capturing respondent feedback. It’s critical that CX practitioners continue to evolve the mechanisms they employ to capture feedback from their customers. Using a platform that does not allow customers to easily share their thoughts will result in fewer responses, less than optimal data and a negative perception of the brand commissioning the research.