
Editor's note: Keith Chrzan is senior vice president of analytics at Sawtooth Software Inc. He can be reached at keith@sawtoothsoftware.com.
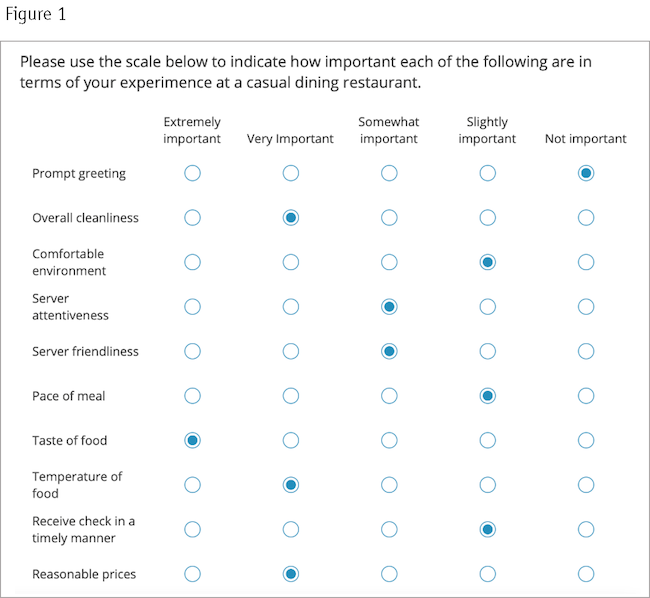
Rating scale data almost always contains scale-use biases: Different respondents use rating scales in different ways. Take for example rating scale data from a study I collected a few years back. Some respondents, like Socrates in Figure 1, use the full width of the rating scale (mean response of about a 3 on a five-point scale).
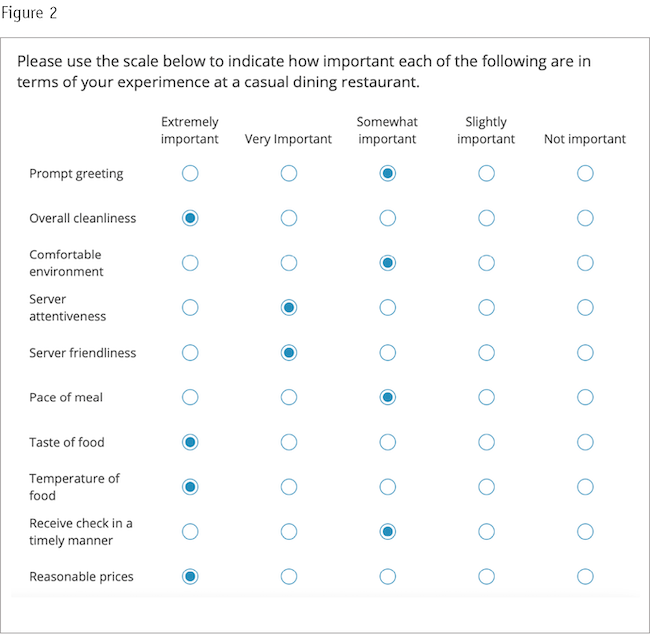
Other respondents, like Jones in Figure 2, pile up their responses only on the top end of the scale, in this case with a mean rating of 4 on the five-point scale.
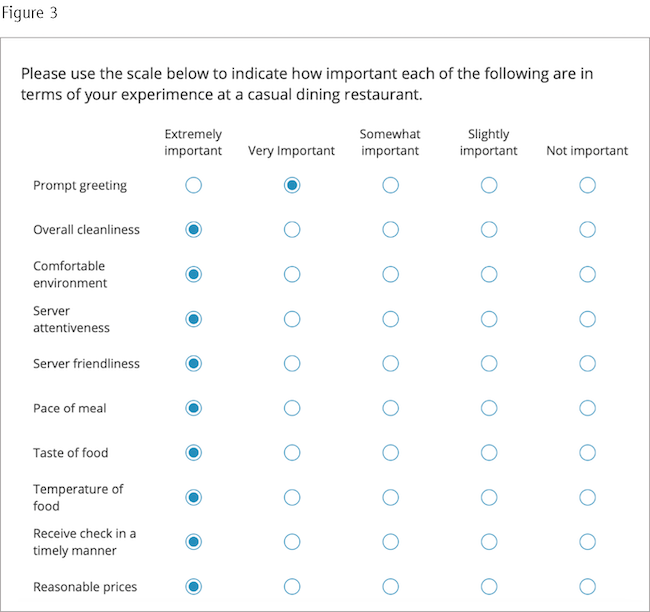
Finally, some respondents, like Bubba in Figure 3, fail to use the scale to discriminate at all, nearly or completely straightlining their responses (Bubba has a mean score of 4.9).
If you’ve looked at rating scale data you’ve probably seen all three of these patterns. Not only do patterns differ across individual respondents, they can also differ systematically between respondents from different cultures or from different countries.
If you try use these 10 rating scale variables as the basis variables for a needs-based segmentation, you’ll almost always find segments of respondents grouped by their use of the rating scale and not by the content of the rating scale. For example, from my surveys of 1,024 respondents, the three-segment solution shown in Figure 4 emerges when I use latent class clustering (I get similar segments when I use k-means clustering).
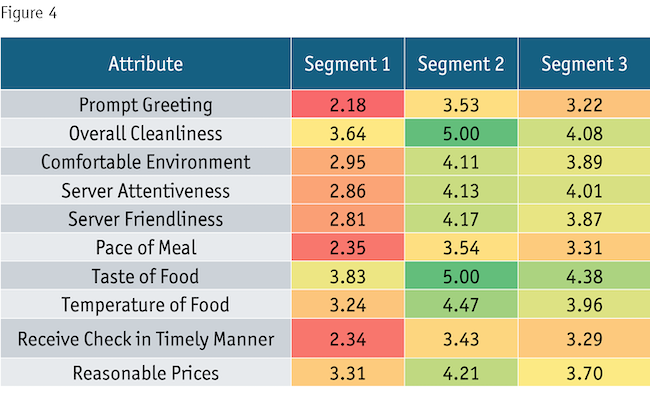
We have a segment of high raters (Segment 2), a segment of low raters (Segment 1) and a segment of folks in between. We might try to hide this fact by running out to five or six segments but still we usually end up with a segment or two of high raters, a segment or two of low raters and a segment or two in between. I should add that this isn’t just a problem with importance ratings; it affects the even more commonly used agree-disagree ratings as well.
Most analysts realize that this means bias in rating scales will pollute their segmentation, so to avoid it, they center their data, subtracting from each respondent’s rating that respondent’s average score – this functionality is even built into commercial cluster analysis programs. What most analysts don’t realize, however, is that mean-centering may not solve their problem at all, because now they may just get a segmentation that groups respondents by the variance with which they respond to the survey questions. And this is exactly what happened in my casual-dining segmentation (Figure 5).
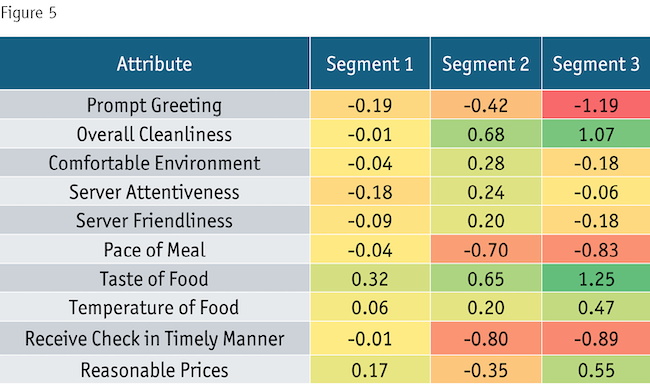
Now we have segments of near-straightliners like Bubba (Segment 1), highly discriminating respondents like Socrates (Segment 3) and respondents in between like Jones (Segment 2). We might try to disguise this by running out to more segments or by column-standardizing the data but the problem and its detrimental effects will still be present, if slightly less evident.
While I’ve shown the above examples from an R&D case study, rest assured that it happens in commercial studies too and with all manner of what are somewhat inaccurately called “Likert-type scales.” In Likert-type scales we present all the items with a single set of scale anchors, like the importance anchors in the earlier examples or degrees of agreement and disagreement.
Hopefully you’re aware or you’ve become aware of how pervasive this problem is for attitudinal and needs-based segmentation studies. What are some solutions?
My preference would be to solve the problem at the research design stage, by choosing better scaling methods.
For needs-based segmentation I advise my clients to use scales that constrain respondents from saying that all attributes are equally important: MaxDiff scaling and Q-sort are two excellent ways to accomplish this, at least up to about 25 items in the first case and up to about 20 items in the second.
For attitudinal ratings, I recommend semantic differential scales. These use bipolar adjective pairs unique to each item, so perhaps a five- or seven-point scale with “Expensive” on the left pole and “Inexpensive” on the right, “Easy to use” on the left and “Difficult to use” on the right and so on. These can often reduce the scale-use biases described above (but not always – sometimes they still occur, even with semantic differential scales).
Another alternative for attitudinal ratings comes from a recent (and excellent) book (“Market Segmentation Analysis: Understanding It, Doing It, and Making It Useful”) by Grün, Leisch and Dolnicar in 2018. They suggest using “doubly level-free binary scales as inputs for segmentation,” though like semantic differential scales, I have seen cases where these scales contain scale use bias as well.
In the event these attitudinal scaling alternatives fail to ameliorate the scale use bias, we may need to try to solve the problem at the analysis stage, by respondent-standardizing the data prior to segmentation.
Of course, any suggestions you have would be most welcome – this is an area where I am certain of the problem, where I have confidence in a solution for needs-based segmentation and where I’m still searching for a “works every time” solution for attitudinal segmentation.