Were respondents lying or trying not to look stupid?
Editor's note: Peter M. Gold is chief executive officer of VeraQuest, an Armonk, N.Y., research firm.
The last 10 to 15 years have seen many new developments in marketing research. Neuroscience, mobile surveys, location-based research, big data, social media, survey gamification, DIY and Google consumer surveys each have garnered the attention, the imagination and even sometimes the disdain of the research community. Having something new and shiny is fun and it gives researchers something to shout about. And, as researchers are notoriously weak as marketers and self-promoters, new technology also gives them the wedge they need to get their foot in the door with clients.
Capabilities presentations that focus on the mundane practices that lead to solid, reliable research are the surest way to lose an audience. Our own data quality slides at VeraQuest were first demoted from top billing to back-of-the-deck fodder, before eventually and ignominiously being relegated to “hidden slide” status. The last time I presented slides on data quality and quality control, the lead client in the meeting said “You can skip this section – we assume you understand how to do this stuff.”
The truth is that most end users are just not that interested in the details that drive quality. And who’s to blame them? Today’s client-side researchers not only are expected to be experts across a myriad of research disciplines but are also expected to be business analysts. Most are swamped with the demands of internal clients, so it’s completely understandable if they don’t have the time nor inclination to do their suppliers’ jobs as well. They have a reasonable expectation that their suppliers will get it right.
The problem, however, is that many smaller research companies lack the know-how when it comes to implementing data quality procedures or they don’t have the financial backing to underwrite the cost. Larger research institutions, on the other hand, which may have the wherewithal to implement standard data quality processes, are frequently beholden to stakeholders other than clients. Resources slated for data quality initiatives simply become costs to cut when cutting becomes necessary. There is little incentive – and in some cases there is a disincentive – on the part of suppliers (large and small) to provide appropriate levels of quality control when clients don’t demand it. Until something blows up and then the cost becomes enormous.
Our firm’s interest in adding questions to surveys in order to identify fraudulent respondents began while we were working with Allan Hauptfeld at Vantage Research + Consulting Inc. on a project for a West Coast bakery. The bakery was interested in obtaining a national read on awareness for its brand in what is a highly fragmented category. The study, which contained just a few questions, consisted of defining the bakery section of the supermarket and then delving into awareness for the client’s brand along with seven regional competitors.
Having some experience working with low-penetration brands, we suggested incorporating two fictitious (ghost) brands as a means of establishing a baseline for “noise.” We believe there will always be some percentage of respondents, perhaps 1 percent to 3 percent, who think they’ve heard of a brand even when the brand doesn’t exist. In other words, they’re honestly mistaken. It happens. However, because even low levels of noise can have a profound impact when trying to analyze results on brands such as the artisan bread client and its regional competitors, it’s advisable to account for noise.
The results from the bakery study, however, were not what we had anticipated. Awareness for the client brand came back much higher than expected. We had figured awareness for the brand would be somewhere in the neighborhood of 6 percent to 9 percent but it came in at 16 percent. Moreover, several other brands we thought would be in the low-to-mid single-digits were in the 11 percent to 13 percent awareness range. The biggest red flag, however, was that the two fictitious brands had generated awareness levels of 9 percent and 12 percent. In other words, awareness of the fictitious brands was comparable to several of the real brands.
Deeply concerned about the accuracy of the data, we started to look for anything that could explain the exaggerated levels of awareness. For example, we found that 3 percent of all respondents said they were aware of all 10 brands – the eight real brands and the two fictitious ones. These respondents were obviously straightlining the survey. If we left things there, we’d be admitting that noise could account for 6 percent to 9 percent of awareness – something we were not prepared to accept.
Not only were individual brand awareness levels higher than expected, but we also felt that relatively few respondents would be aware of more than one or maybe two brands. Yet, 11 percent of national respondents said they were aware of five or more of these artisan bread brands. If we actually eliminated all of these respondents from the data, most of the brands’ results would line up with expectations. Unfortunately, even though we suspected that a portion of our respondents weren’t answering the survey truthfully, aside from straightliners we had no real basis for throwing out respondents – we couldn’t assume that those people claiming to be aware of the real brands weren’t being truthful. We also didn’t want to assume that those claiming awareness of one or both fictitious brands were fraudulent respondents.
Identify and eliminate
Based on the findings from this study and a few other studies we had conducted at the same time, we decided to embark on research of our own, with the intention of devising a plan that would allow us to identify and eliminate fraudulent responders from all our surveys. Straightliners, we believed, would be relatively easy to spot. Based on the artisan bread study, however, we felt the majority of fraudulent responders would be less obvious.
We acquired another learning through the bakery study, which we felt we could apply to our research-on-research. In the bakery study the brands were relatively small but they were real. As stated previously, the purpose of the study was to measure awareness of small bread brands among a national audience. We have to keep in mind that people who live outside of a relevant brand region may have previously lived or travelled there. Therefore, we couldn’t simply dismiss brand-aware respondents outside a market area as being fraudulent.
That said, asking about fictitious brands in our research seemed like a promising way to identify fraudulent respondents but we figured we would need more than just two of these ghost brands. We needed a list long enough that we could make confident judgments about who was being untruthful, so we generated fictitious brand lists within three categories – juice, chips and shampoo – and we came up with 30 brands in all, 10 per category. We were diligent about researching the names, as we didn’t want our fictitious names to be similar to the names of real brands. We wanted them to be believable but it would only serve to undermine the study and our objectives if the fictitious names we created were easily confused with real ones.
Because VeraQuest is a frequent provider of omnibus surveys, where typically there are multiple clients on each survey, it is a relatively simple task to unobtrusively embed additional questions between client sections. The multi-topic omnibus format also provides a sort of natural survey terrain in which to camouflage research-on-research questions.
Normally we provide a minimum of 1,500 respondents for our omnibus surveys and we typically obtain those respondents from a single sample provider. For this research, however, we utilized sample from two vendors. One of our objectives was to determine whether the fraudulent respondent issue we encountered in the bakery study was supplier-specific or whether it might be occurring in other panels too. It would have been ideal to assess a handful of other sample suppliers at the same time but doing so wasn’t feasible. Moreover, we wanted to focus on our primary objective of devising a system that would allow us to identify and eliminate fraudulent responders. It’s worth noting that neither sample provider knew we were conducting this test, as we did not want to jeopardize the integrity of the research.
The objectives of the research were fourfold:
-
Is the problem provider-specific or is it happening elsewhere?
-
Could a list of fictitious brands help us to identify, and thus be able to exclude, fraudulent responders?
-
If so, would pick-list (multiple-choice) responses be preferable to yes/no grids in identifying fraudulent respondents?
-
Does it make sense to add at least two real brands into the list of fraudulent brands?
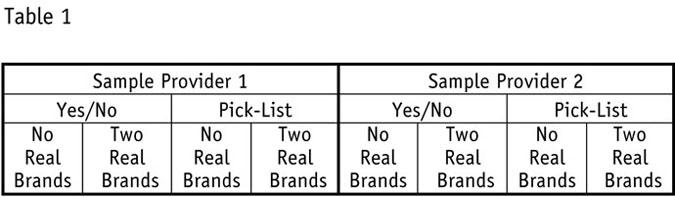
In order to address all of our objectives, we used an eight-cell design (Table 1).

Note: The results we are about to show are from our main sample provider only. We never intended to analyze aggregated data because we needed the capacity to show results to each vendor. Aggregated data would have been useless as a diagnostic tool and sharing competitive data with each vendor would have constituted an egregious breach of trust.
Objective 1: Is the problem provider-specific or is it happening elsewhere?
Without going into great detail, we saw a problem in both data sources, with our primary provider being the less problematic of the two. Through use of the fictitious brand methodology detailed in this article, we found that that both data sources showed evidence of fraudulent responding. In other words, both sample providers yielded sufficiently large numbers of respondents who selected several of the fictitious brands to suggest that the issue was not isolated to one supplier. While vendor evaluation was an internal objective, it is not the goal here; hence, for the remainder of this article we are focusing exclusively on the sample from one sample source – our main sample provider.
Objective 2: Could a list of fictitious brands help us to identify, and thus be able to exclude, fraudulent responders?
As I alluded to earlier, we asked about brand awareness within three categories – juice, chips and shampoo. Keep in mind we were testing other variables as well; therefore, the awareness data are aggregated for cells that contain pick-list responses, yes/no responses, as well as lists that contained no real brands and lists that contained two real brands.
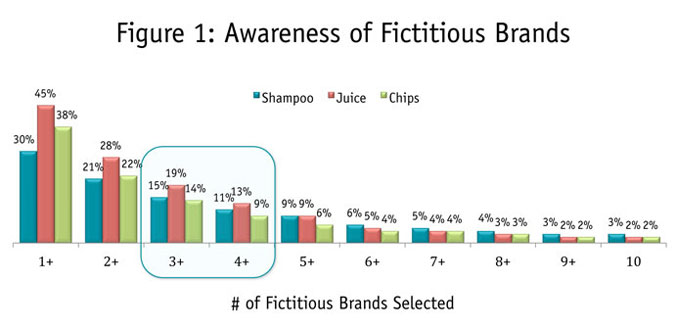
We focused our analysis on three data points: 1) those claiming awareness of all 10 fictitious brands, 2) those claiming awareness of three or more fictitious brands, and 3) those claiming awareness of four or more fictitious brands. The reason for our interest in these data points is that, first, selecting all 10 fictitious brands represents unabashed straightlining. Also, stated awareness of just one or two fictitious brands seemed like it could be the result of a plausible mistake, while stated awareness of four or more fictitious brands seemed much more likely to be the result of duplicity.
We found that 32 (or 3 percent) out of the 1,101 respondents for shampoo straightlined the responses, which was exactly what we saw in the bakery study. For both juice and chips, 2 percent were straightliners. We also found that between 9 percent and 13 percent of respondents reported being aware of four or more fictitious brands, while between 14 percent and 19 percent said they were aware of three or more fictitious brands (Figure 1).
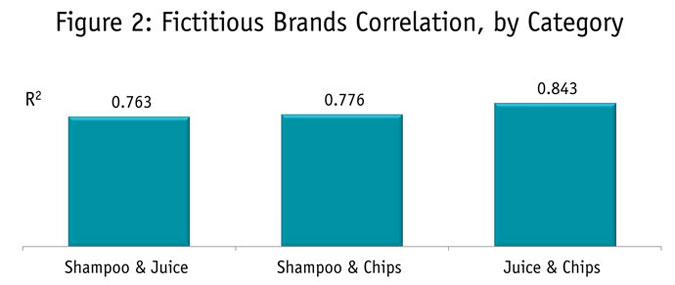
We also wanted to understand whether respondents who exhibited fraudulent-type behavior in one category were likely to exhibit it in others. It’s logical that if false positives are purposeful rather than accidental, we would expect to see a strong correlation across categories. And in fact, we do see a very strong relationship between categories (Figure 2). The R2 was .763 for shampoo and juice, .776 for shampoo and chips and .843 for juice and chips. Said another way, the number of fictitious brands a respondent chooses in one category is a very good predictor of how many they will choose in other categories.
It seems quite evident from the data that this approach – the use of fictitious brand lists or something comparable – could be an effective method of identifying fraudulent respondents. Where to actually draw the line as to what is an acceptable number of false-positives and what is not, however, is perhaps not so clear-cut. Using a zero-tolerance policy to eliminate respondents (i.e., deeming respondents who claim awareness of just one fictitious brand as fraudulent) would be unrealistic. Even eliminating respondents who claim awareness of two fictitious brands seems too aggressive. As much as we want to be rid of fraudulent respondents, we don’t want to go overboard and exclude good ones. At our firm, we currently use a proprietary algorithm that considers several factors. At the end of the day, however, it is something that each research firm and sample provider need to jointly agree upon.
Objective 3: Would pick-list (multiple-choice) responses be preferable to yes/no grids in identifying fraudulent respondents?
At this point, we have concluded that fictitious brand lists could be employed to help identify fraudulent respondents. The purpose of our next assessment is to determine if using response sets in the form of pick-lists are favorable to yes/no grids.
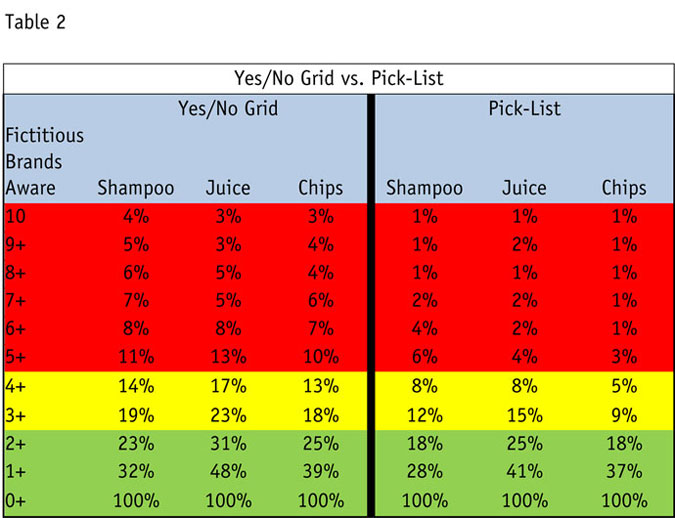
The data are very interesting in that the yes/no grid format appears to do a better job of capturing fraudulent responders than does the pick-list format. (You can see in Table 2 that the numbers on the left side of the table are considerably higher than those on the right.) However, we don’t know if the numbers are higher because the yes/no grid format is more effective at detecting them or if it’s because the yes/no grid actually encourages fraudulent survey behavior.
Additionally, the fact remains that respondents can cheat more or less undetected in the pick-list format because all they need to do is not answer. It’s what we might refer to as “the sin of omission.” So we still have a quandary. Or do we?
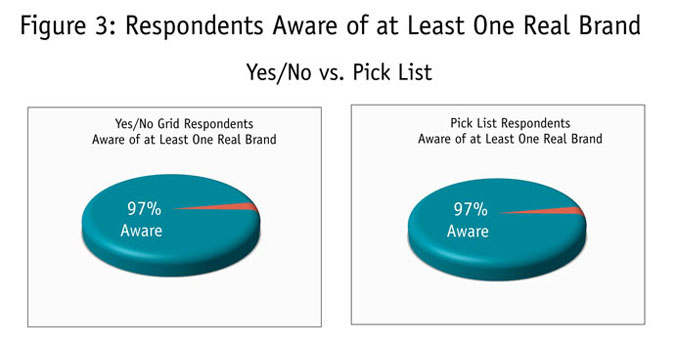
If respondents with the pick-list format are, in fact, more prone to cheating by simply omitting responses, then they should also be selecting real brands (when real brands are available) at a lower rate than those respondents who fall into the yes/no grid format. In other words, if these respondents are cheating by essentially not selecting anything, then they shouldn’t be selecting real brands either.
However, as shown in the two pie charts in Figure 3, there is no difference between the two formats in terms of the percentage of respondents who claim awareness of a real brand. This finding then supports the notion that the higher failure rate observed for the grids is probably a manifestation of the grids themselves. Or, said another way, the use of grids to detect cheaters may be counterproductive in that their presence may actually encourage the very behavior we’re trying to eliminate.
Objective 4: Does it make sense to add at least two real brands into the list of fictitious brands?
Just as we were concerned that response type (yes/no grids vs. pick-lists) could influence how respondents might answer questions about fictitious brands, we also wanted to see how the inclusion of a few real brands might impact results. The left side of Table 3 represents the cells where there were no real brands included in the brand list, and the right side reflects data from the cells where two real brands were included. The difference is dramatic. The failure rate (false positives) on the left side of the chart – the side with no real brands – is substantially higher than the failure rate on the right side.
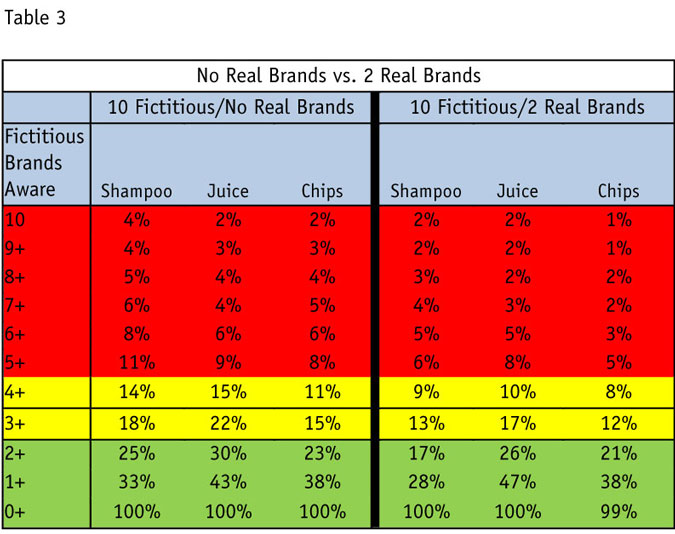
We believe this lends some support to the idea that omitting real brands from the list fosters false positives. It also seems fairly intuitive as well. From a respondent’s perspective, it’s easy to see how one might think that a list of brands should not be totally free of brands they know. We might think of it as “the emperor’s new clothes” effect. In this case, being unaware of all 10 brands listed for a widely-used category could negatively affect one’s self-image, thereby encouraging a respondent to select one or more brands they’ve never heard of so as not to appear “stupid” or “out of touch.” One might be inclined to remove these respondents from the data since they claimed awareness of fictitious brands, when in fact he or she would have provided perfectly good data had they not been made to feel “stupid” by the purely fictitious brand list. Again, we don’t want to needlessly exclude respondents who might otherwise provide perfectly valid results.
High level of diligence
As researchers who have been on the forefront of online research since the late ’90s, we firmly ascribe to the philosophy that sample quality cannot and should not be the sole responsibility of sample providers. We do expect there should be a high level of diligence to keep bad respondents out of our sample. However, some percentage of these bad respondents will make it through anyway. And even if sample providers do a perfect job keeping out the bad guys, some respondents may go bad over time. Moreover, some respondents may have the best of intentions but poorly-constructed surveys may confuse and frustrate them. One way for annoyed respondents to exact revenge on researchers is by being inattentive and even possibly malicious.
Therefore, when it comes to ensuring respondent accuracy, it is the responsibility of the researcher to provide another layer of security – to identify and deal with bad respondents who may have penetrated the sample provider’s defenses or previously-good respondents who went bad over time.
We believe that surveys themselves should include measures to help guard against fraudulent respondents. Unfortunately, there are practical limitations on what sample providers can do within the framework of a survey, since they don’t always have the latitude to alter a questionnaire. Therefore, it’s incumbent upon the client-facing researcher to implement those measures necessary to ensure the highest-quality data.