
We can do better
Editor's note: Based in Boston, Ken Faro is vice president, research, decision science, and Elie Ohana is researcher, decision science, at advertising agency Hill Holliday.

We’ve all used it. Top-box scoring, the reporting of Likert scale questions by the percent of respondents who select the top number on the Likert scale (e.g., 5 on a five-point scale; 7 on a seven-point scale), is widely used in marketing and advertising. However, as market researchers, we must ask ourselves whether or not this is the “right” statistic to report. While it may be the right statistic to use in a small number of cases, it is our belief that, generally speaking, it is the wrong measure to use. Why is top-box scoring the top mistake marketers make? In this two-part article, we explore both conceptual and statistical reasons for our position.
Faced with the question
The first conceptual reason against the use of top-box scoring is related to psychology’s version of a field-dividing topic, such as evolution’s “the chicken or the egg” or biology’s “nature vs. nurture.” We are referring to the “trait versus type” debate. When we talk about measurable psychological aspects of individuals, such as intelligence, extraversion or intent to purchase, we are faced with the question of how to best describe these psychological phenomena. Do we describe them as traits, where individuals fall somewhere on the continuum between low on the trait to very high on the trait? Or, do we describe them as types, where individuals fall into one discrete category or another? You can think of the following points to help develop an intuition around the trait-type distinction:
- Traits are atomistic (i.e., the building blocks of personality), whereas types are systemic (i.e., “the whole is greater than the sum of the parts”).
- Traits are explanatory (i.e., traits cause behaviors), whereas types are descriptive (i.e., behaviors are an expression of type).
- You measure an individual’s traits, whereas you sort individuals into types.
- Traits are measured on a continuous scale (e.g., think a range between 0 and 100), whereas types are measured as dichotomous (i.e., you are the type or you’re not).
- Individuals differ on the degree of a trait, whereas individual types are qualitatively different.
Proponents of the Big Five personality theory subscribe to trait theory, where individuals might score low on extraversion but high on openness. Those who use the Myers-Briggs Type Indicator (MBTI) often subscribe to a type theory, where individuals are binned based on types of behavioral expression (e.g., INFP type are those who score high on introversion, intuition, feeling and perception).
It is the opinion of both authors that when it comes to traits versus types, traits are the preferred psychological construct for a few reasons:
- The majority of psychological constructs are intuitively conceptualized as having an underlying continuum. Intelligence, personality or emotion are examples more easily thought of as constructs that people can be low or high on (e.g., low extraversion or high extraversion) rather than being neatly categorized as one type or another (e.g., extraverted type or introverted type).
- When it comes to the predictive validity of constructs, research predominantly supports the existence of underlying continuums rather than underlying classes. We will demonstrate this with the difference in adjusted-R-squared in our study below.
- Categorical measures of psychological constructs display less of everything – lower reliability, statistical significance, power, effect size, etc. We will demonstrate some of these in our study below.
Why is this relevant to top-box scoring? The real question for market researchers is: Why do they bin consumers (top-box vs. not-top-box) when the construct we are measuring (e.g., ad-liking or purchase intent) varies along a continuum from low to high? Why take a construct such as “overall liking of the ad,” measured continuously on a seven-point Likert scale, and break it into “like it” (box 7) vs “dislike it” (boxes 1-6)? From a conceptual standpoint, the statistic we are using doesn’t fit the phenomena we’re studying.
Second methodological problem
Even if we put aside the argument that “psychological constructs vary along a continuum and therefore we should measure them on a continuum,” we run into a second methodological problem: By using top-box scoring we remove measures of individual difference in favor of counting “similar” people. That is, measuring a trait allows us to see how different people have varying levels of a given trait – it’s about observing how individuals are different. This is vastly different than the practice of top-box scoring, which is used for the purpose of calculating percentages of similarly grouped individuals. For example, if 56 percent of people indicate they are a democrat on a survey, it is assumed these people have similar political beliefs and are a discernable group when compared to others who indicate that they are republican. One can say that measuring of traits is aligned to “trait theory” (as we discussed in our last section) whereas counting people is aligned to the “type theory” approach (e.g., Are you a typical republican or democrat? You must fit one or the other class/group). The core problem with counting people is that we group together individuals that actually vary in level of similarity and label them as similar.
We can show this with a specific example. In our own advertising research, we might want to look at how people differ on the trait of “overall liking of an ad,” measured continuously on a seven-point Likert scale where 1 represents “like it” and 7 represents “dislike it.” Let’s look at some hypothetical data.
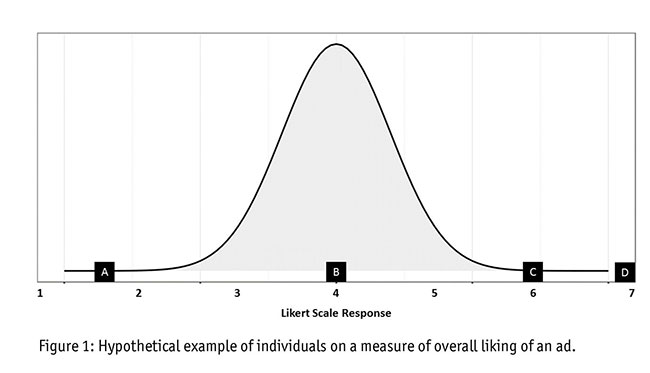
As you might expect, Respondent A does not like the ad (Figure 1). Respondent D really likes the ad. Respondent C also likes it but not as much as D. We can clearly see that different individuals score differently on this trait. What happens when we break this trait up via top-box scoring?
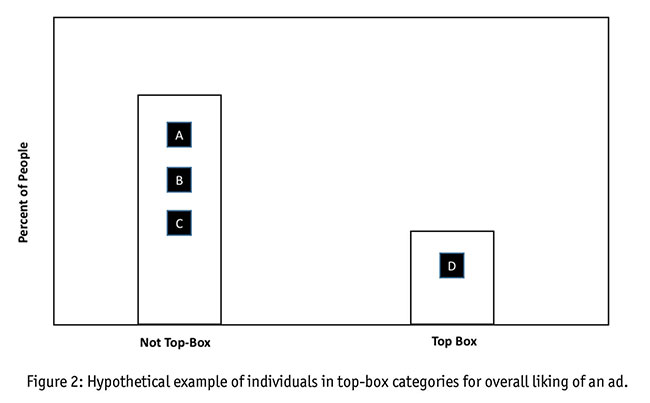
As you can see (Figure 2), we’ve grouped Respondent D into the top-box group and Respondent A, B and C into the non-top-box group. But herein lies the issue. We’ve grouped Respondents A, B and C together, implying they are similar (read: that they scored similarly on the underlying trait). However, we know from Figure 1 that Respondent C was actually more similar to Respondent D than they were to Respondent A or B. Our grouping doesn’t stay true to the underlying trait we were measuring and it doesn’t accurately portray our respondents. Therefore, we are faced with the following questions: Is top-box scoring actually more inaccurate than it is accurate? By using top-box scoring are we giving our clients information that is actually artificial and false?
May not be aligned
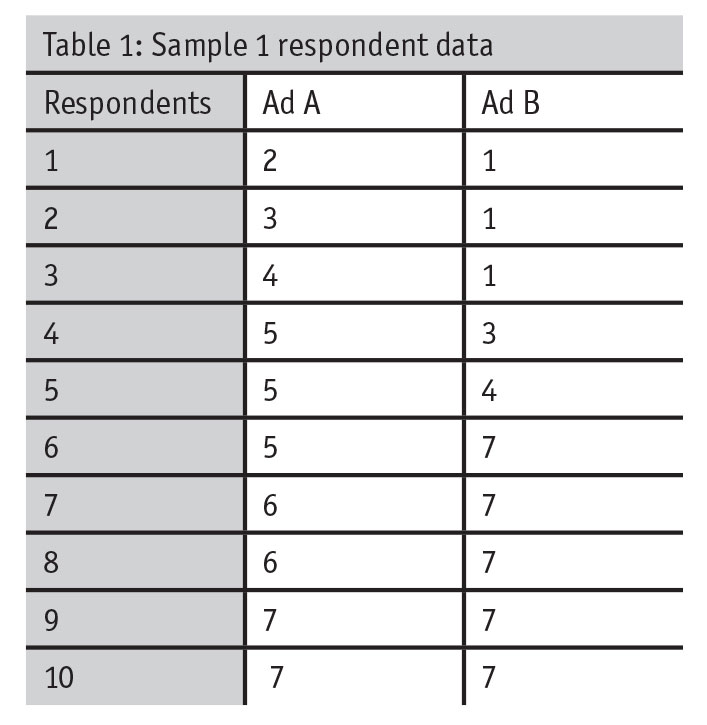
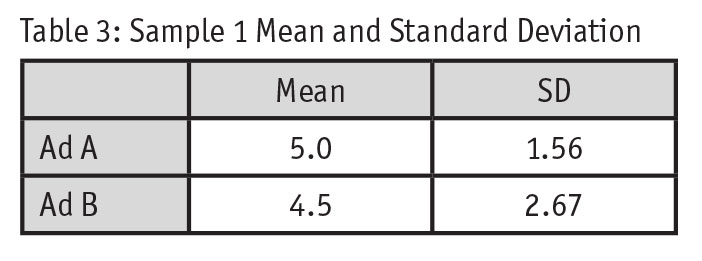
The third conceptual reason against a general and indiscriminate use of top-box scoring is directly related to the underlying theme to the first two conceptual reasons: the statistic we’re using may not be aligned with the overall goal of our research. Taking a step back, it’s important to think about what we want to measure versus what top-box actually measures. Generally speaking, our research problem is to assess if people like one ad more than another. To test this, say we ask respondents, “Overall, to what extent do you dislike/like this ad?,” which could be rated on a scale from 1 (“I dislike it”) to 7 (“I like it”). Example respondent-level data might look like this:
For Ad A, the top-box score is 20 percent while the top-box score for Ad B is 50 percent (Table 2). By using the top-box score, Ad B is the clear winner.
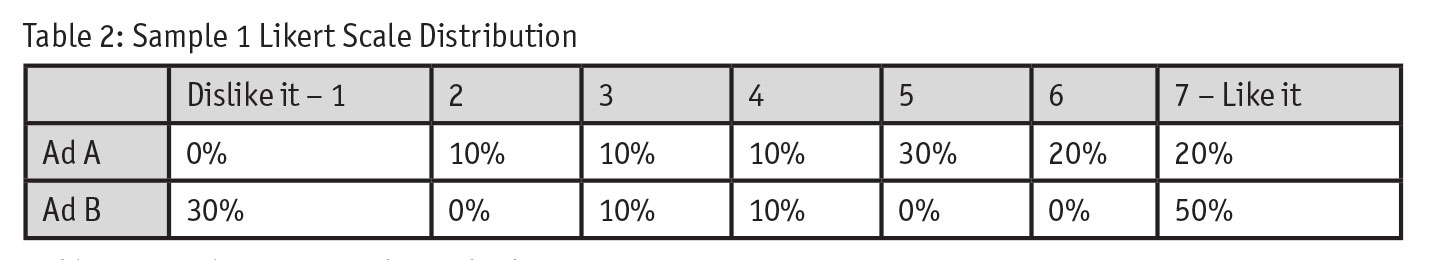
What does this really tell us? Generally speaking, it tells us Ad B has more people that “like” the ad. More specifically, it tells us that there are more people on the extreme high end of the trait being measured. But why do we care about the extreme high end? Why don’t we care about people who dislike the ad (and might be offended by the ad)? While Ad B has the biggest top-box score, it also has the bigger bottom-box score. If we treat this Likert scale similar to a Net Promoter Score (score “net liking” as top-box minus bottom-box), the “net overall liking” is equal – net 20 percent for each ad. How do you interpret that? It’s tricky.
Even if top-box and bottom-box scores yielded a clear winner rather than a tie as in the above example, why do we neglect the other intermediary feelings along the trait being measured? Don’t we want to know the full distribution of how potential customers might feel? Of course we do! We might be researchers but we are also marketers at heart and at the end of the day, we’ll take all the customers we can get. So why do we have a measure that neglects the majority of potential consumers?
One dominant reason
In the years both authors have been practicing market research, one dominant reason has surfaced for why people request that we shift our reports from averages to top-box scores: Stakeholders say, “Averages are too hard to understand. Top box is more intuitive.” The fact that we give in to this reasoning suggests one of two things. One, researchers do not have a good conceptual understanding around which statistic should be reported and why. Consequently, they find it acceptable in all cases to report top-box scores. Or two, researchers sometimes lack the ability to articulate how to interpret averages effectively.
As market researchers, it is our job to understand the advantages and disadvantages behind both averages and top box scores. It’s also our job to understand these well enough that we are able to explain both statistics to technical and non-technical audiences. An inability to effectively communicate the measures that are most appropriate for our clients is a big problem for our industry. If we were clients, our concern would be that if researchers don’t understand something as basic as the concepts behind averages and top-box scores, how do they conceptually understand the statistics in more complex analyses like cluster analysis, conjoint and other advanced techniques?
Tells you less
Conceptually speaking, a dichotomous variable (top-box or not-top-box) is more intuitive to understand than a five-point or seven-point Likert scale. It takes less cognitive effort to understand that 36 percent have a top-box score than to understand that an ad has an average liking score of 3.6. However, those of us in marketing and advertising know all too well that human nature errs on the side of mental shortcuts not always used to our advantage. Using top-box scores might be one of those times our mental shortcuts lead us astray. Top box might be more intuitive to understand initially but it tells you less about the construct you’re studying. As we’ve shown above, top-box scores tell you less about what you’re studying because they conceptually group cases that don’t belong together. Next issue, in part two, we’ll also show you how a top-box measure provides less information statistically.