Editor’s note: Nicole Mitchell is a knowledge specialist for SSI, Shelton, Conn.
According to a report published in January of 2014 by Pew Research Center, 58 percent of U.S. adults own a smartphone. Since 2011, nearly a quarter of U.S. adults have purchased their first smartphone. More shockingly, the growth of tablet ownership increased from 3 percent in 2010 to 42 percent in 2013. As ownership of these devices increase, it is important that we examine how the usage of these devices will shape the future of online data collection. In this article, we focus on two main questions:
1. How does survey design affect mobile respondent behaviors?
2. Will the data quality of mobile phone and tablet responses be of a lesser quality than laptop and desktop users?
SSI conducted a study of 5,501 U.S. respondents age 18 and older. The sample was composed of 1,869 mobile phone respondents, 1,435 tablet respondents and 2,197 laptop/desktop respondents. To determine which device a respondent utilized to access the survey, we captured and stored the operating system information as well as obtained self-reported data on which device they were using to access the survey.
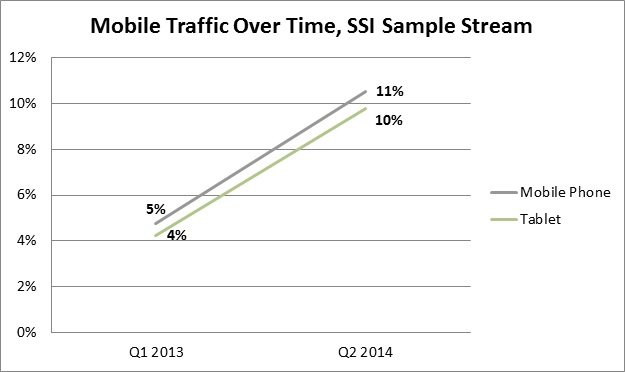
It’s important to understand these issues now because respondents are choosing mobile to take survey in increasing numbers. By examining our entire sample traffic stream of respondents over the past 15 months, we see that mobile traffic has increased from 9 percent to 21 percent. Mobile phone survey takers increased from 5 percent to 11 percent, while tablet users increased from 4 percent to 10 percent.

Impact of survey design by device
SSI designed an experiment that consisted of three different survey treatments to examine how survey design impacts the mobile user. Below is a description of the three treatments:
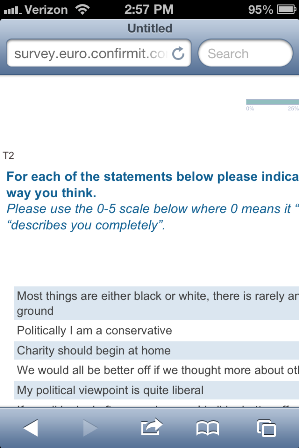
Mobile-unfriendly
• The survey page is a smaller version of a traditional desktop/laptop Web page.
• The survey page is not responsive to different screen sizes and it needs zoom-in or horizontal scrolling (e.g., the screenshot below only shows half the page).
• The font size is small and survey elements are tiny and difficult to read and select.
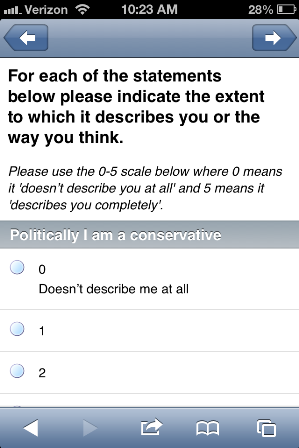
Mobile-friendly
• The survey page renders properly on the different screen sizes.
• It is clear to read and easy to select.
• Horizontal scrolling is minimized.
• A similar look and feel to a PC browser but adapted to mobile.
• The traditional grid question is asked as multiple single answer questions across all devices.
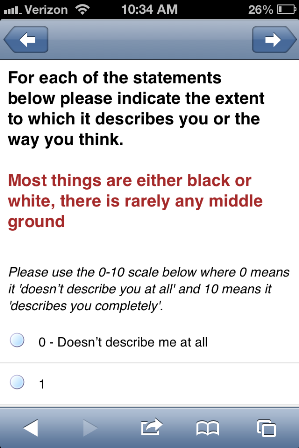
Mobile-optimized
• Designed specifically for a mobile device where the survey program recognizes the device and optimizes the survey for mobile respondents
• The survey layout is optimized by removing unnecessary elements.
• There is no horizontal scrolling.
• The grid question is shown as multiple single-answer questions on the mobile phone. However, on tablets, laptops and desktops the traditional grid format was shown.
We looked at abandonment rates – how long it took for respondents to complete the survey – and overall satisfaction after completing the survey.
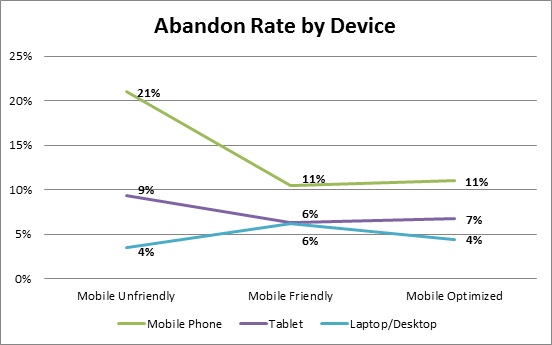
Abandon/drop rate
Respondents who received the mobile-unfriendly version were more likely to abandon the survey if they were on a mobile phone (21 percent) or tablet (9 percent) than respondents using a PC/laptop (4 percent) to access the survey. The mobile-unfriendly and mobile-friendly implementations of the questionnaire had the lowest rate of abandonment among respondents accessing the survey utilizing a PC/laptop. Conversely, the abandon rate for mobile-optimized and mobile-friendly versions of the questionnaire was lowest among respondents who used a mobile phone or tablet to access the survey.
Length of interview (LOI) by device
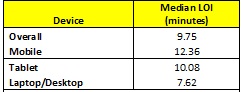
The median time for the interview (LOI) was 9.75 minutes across all devices. The median time among respondents who accessed the survey using a mobile phone was 12.36 minutes, while the median time for tablet respondents was 10.08 minutes. Laptop/desktop respondents took the least amount of time to complete the survey with a median time of 7.62 minutes.
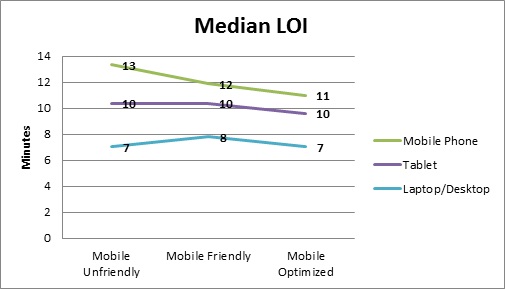
Length of Interview (LOI) by questionnaire implementation and device
Across all devices, the mobile-optimized questionnaire design took the least amount of time to complete. Respondents on a mobile device completed the optimized version of the question in 10.99 minutes, tablet respondents completed this version in 9.60 minutes and laptop/desktop users completed the optimized version in 7.02 minutes. Not surprisingly, the laptop/desktop users also completed the mobile-unfriendly version in the same amount of time as the mobile-optimized version. Overall, respondents who completed the survey using a laptop/desktop took the least amount of time to complete the survey for all questionnaire versions.
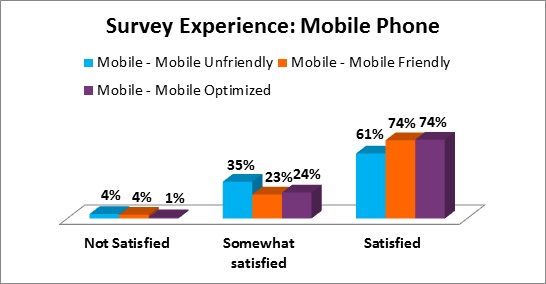
Lastly, we examined respondents’ overall satisfaction level after completing the survey. At SSI all respondents receive an opportunity to provide feedback on the survey they just completed. This data is how we determine the SSI QUEST Score. As expected, we found that mobile respondents who completed the mobile-unfriendly version of the survey were less satisfied with their overall experience than mobile respondents who completed the mobile-friendly or -optimized version of the survey. However, when we examined the overall satisfaction among those who used a tablet or laptop/desktop to access the survey we found no significant differences. In sum, a mobile-unfriendly survey results in a poor respondent experience for mobile survey takers, especially mobile phone respondents.
Data quality
An important question in our research was, “Will the data quality of smartphone and tablet users be worse than that of laptop and desktop users?”
The following quality control tests were implemented to examine data quality: speeding; straightlining; selecting low-incidence answers; and conflicting answers.
Speeding
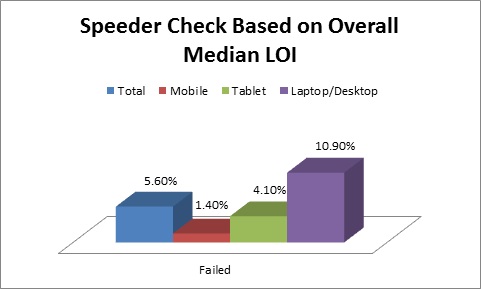
Speeders were defined as any respondent who completed the study in less than .48 percent of the median LOI. Using the overall median time of 9.75 minutes, we flagged any respondent regardless of device who completed the survey in 48 percent of the overall median time and 5.6 percent of respondents were flagged for speeding. However when we examined completion speed by device, we found that respondents who accessed the survey using their tablet or laptop/desktop were disproportionately flagged as speeders.
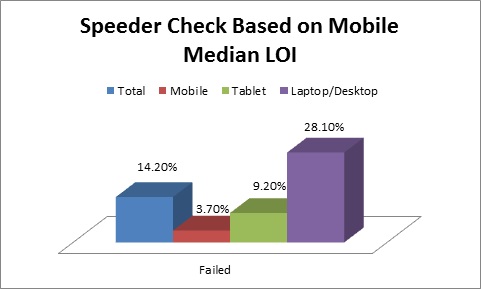
As noted earlier, tablet and laptop/desktop respondents completed the survey in less time than respondents who accessed their survey using a mobile phone. So we examined what would happen if we created a speeding rule for each device based on each device’s median time. When we calculated the speeder check based on the mobile median LOI of 12.36, we flagged 28.1 percent of laptop/desktop respondents as speeders – almost three times the number of respondents who were flagged using the overall median time. We also flagged 9.2 percent of tablet respondents as speeders which is more than double the amount flagged via the overall median LOI.
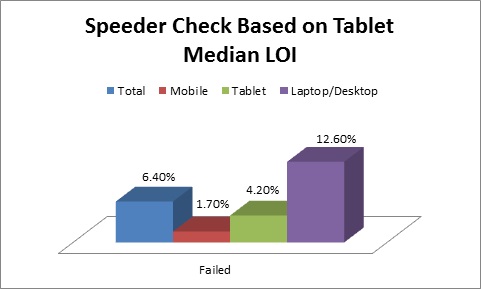
Calculating the speeder check rule based on the tablet median LOI flagged fewer laptop/desktop respondents than the mobile speeder check, but it still flagged more than the overall speeder check. The tablet speeder check flagged nearly the same number of tablet and mobile phone respondents as the overall speeder check.
In comparison to the mobile phone and tablet speeding rule, the speed check based on the laptop/desktop median LOI flagged the fewest respondents across all devices.
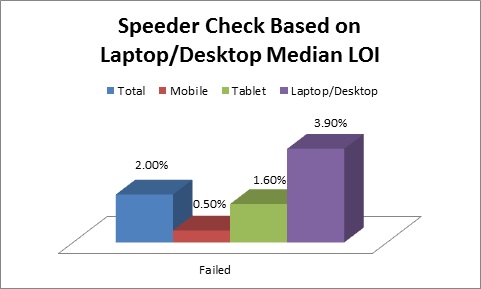
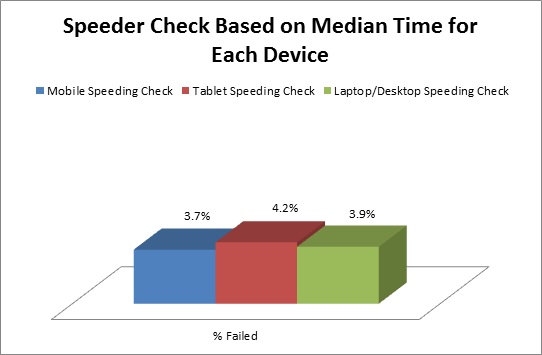
Does this mean that the laptop/desktop median LOI is the best speeder check or is it safe to assume the overall speeder check is fair enough? The laptop/desktop speeder check may be too lax in determining data quality for the other two devices. As demonstrated in the chart below, when we created a speeding rule for each device based on flagging those who completed in less time than the median time for each device, we found that we flagged approximately the same number of respondents for each device. Thus, we recommend using a speeder rule for each device based on the median time of that device and flagging respondents accordingly. If this is not practical, we do not recommend using a speeder check alone, but only in conjunction with at least one other quality-control check before removing respondents for providing poor data quality.
Straightlining
A respondent was flagged for straightlining behavior if they provided the same answer for a set of nine statements that either appeared in the traditional grid format, in a series of single questions or in a grid template designed for all devices.
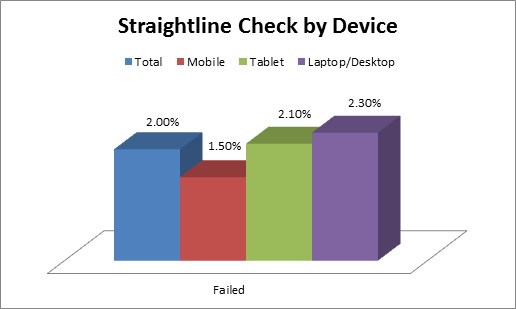
Only 2 percent of respondents failed the straightlining check. Overall, mobile respondents were less likely to engage in straightlining behavior than tablet and laptop/desktop respondents.
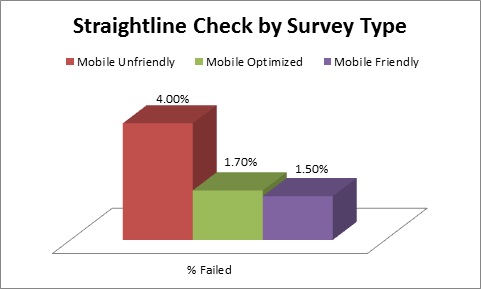
Across all devices, the mobile-unfriendly questionnaire had the largest percentage of respondents engaging in straightlining behavior. This is not surprising since regardless of device, respondents assigned to the mobile-unfriendly version were exposed to the traditional grid question design. The questionnaire versions that were more accommodating to a mobile device had significantly fewer respondents engaging in straightlining behavior.
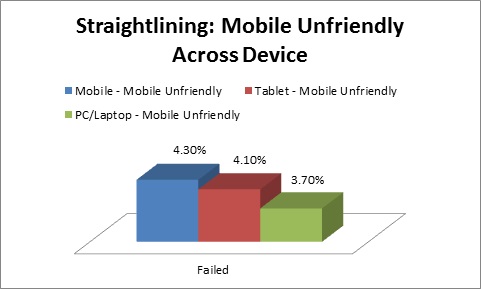
Although not statistically significant, we did find differences when we examined straightlining behavior among respondents who received the mobile-unfriendly version by device. Respondents who accessed the survey using a mobile phone were slightly more likely to engage in straightlining behavior than respondents using a tablet or laptop/desktop. These results are consistent with previous findings by my colleague Pete Cape which suggest that the traditional grid encourages fast processing of items which can lead to straightlining behavior.
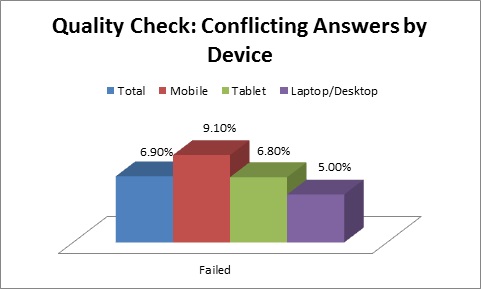
Conflicting answers
The third quality-control check flagged respondents who provided answers that were in opposition to one another. Respondents were presented with a five-point or 10-point scale where they were asked to indicate whether the below statements either “describes me completely” or “doesn’t describe me at all.”
o “Most things are either black or white, there is rarely any middle ground”
o “Everything is shades of grey, it all depends on your viewpoint”
Mobile phone respondents (9.10 percent) were more likely to provide conflicting answers when asked how much the above statements described them.
Based on the above result and that the question sometimes appeared in a grid format, we examined this quality check among mobile phone respondents and the survey version they received. The results demonstrate that 14.8 percent of mobile phone respondents failed this check when they received the mobile-unfriendly version of the survey.
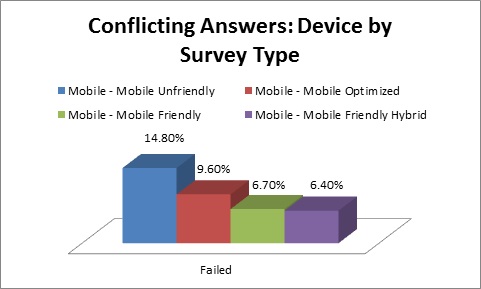
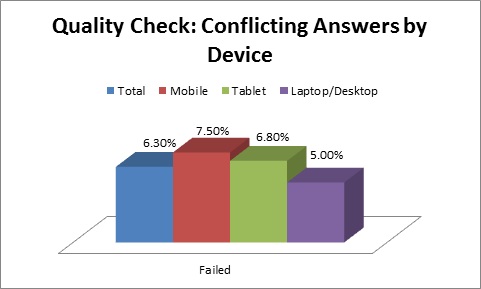
When we removed the mobile phone respondents who received the mobile-unfriendly traditional grid question, the percent of mobile phone respondents failing the conflicting answers quality check declined significantly. Presenting the traditional grid to respondents who access surveys on their mobile phone may result in poor data quality.
Selecting low-incidence answers
The final quality-control check flagged respondents who selected two sets of statements that have a relatively low likelihood of occurring. Respondents were flagged if they selected: “Purchased a new house in the past year” and “Purchased a condo in the past year” OR selected “Purchased a new automobile in the past month” and “Purchased a used automobile in the past month.” Overall, less than 1 percent failed the low incidence quality control check.
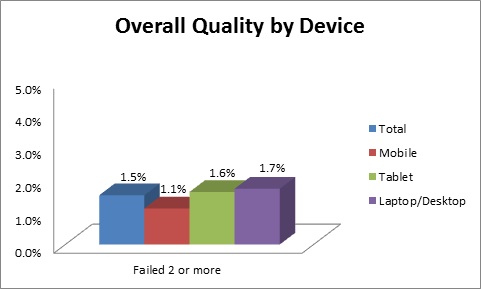
Overall quality
So how does the quality picture look overall? Using the two or more rule to determine whether a respondent should be removed from the data due to poor behavior, we found no statistically significant differences between devices.
Adjusting for mobile
Respondents will struggle through mobile-unfriendly questionnaires on mobile devices, but the quality of their responses will be lower. There are considerable risks in making non-optimized surveys available to mobile respondents. What if they forget to scroll horizontally and are only able to see the left-five columns of a seven-column scale in a grid? What if small radio buttons cause them to select the wrong answers in error?
Our research shows that quality control measures must be adjusted for mobile survey-takers. Judging them based on quality control measures designed for laptop survey-takers will result in us rejecting “good” answers from mobile respondents.
With respondents increasingly opting to take surveys on mobile devices, now is the time to adjust our questionnaires, our quality controls and our thinking to incorporate the rapidly growing mobile survey-taking population.