One choice stands out
Editor's note: Bryan Orme is CEO and president, and Keith Chrzan is senior vice president, at Sawtooth Software.
We all know how important it is to figure out the right price to charge. After all, price is one of the key levers in marketing! Charging the right price lets you capture the value and profits your business has earned. So how do we determine an optimal product/service price?
Researchers and academics have proposed multiple survey-based pricing research approaches over the decades (described below) but conjoint analysis is one of the most realistic, powerful and widely trusted approaches.
Before delving into survey-based methods for pricing research, we should recognize that it is possible to conduct pricing research using real sales data. We could conduct in-market pricing research tests to vary our price and capture sales data from paying customers but this can be expensive and risky. Plus, what your competitors do during your in-market test could foul up your pricing experiment.
We could also analyze past sales data to develop models that predict market reactions to price changes. However, existing data often aren’t robust enough, with enough independent price changes to stabilize the kinds of predictive models needed to pinpoint optimal price points for revenue or profit.
On top of the challenges facing in-market tests and models based on existing sales data, crucial blind spots are that they cannot deal with not-yet-launched products, proposed modifications to existing products or setting prices for proposed line extensions. Survey-based techniques, especially conjoint analysis, are recommended for these common situations.
Three approaches to conducting marketing research about pricing
Survey research lets you test different prices and measure the price sensitivity for consumers and key market segments – before you go to market. Unless the survey is realistic and mimics the buying decision (and this can be challenging to do), respondents aren’t going to give you accurate data about how price motivates them. Are there effective survey-based methods for setting optimal prices? Three approaches are commonly used: Van Westendorp’s price sensitivity meter (PSM), Gabor-Granger and conjoint analysis. As we explain below, the first two techniques have key drawbacks. Conjoint analysis (aka, discrete choice experiments), when done well, tends to be more realistic and useful than the other two approaches.
Van Westendorp price sensitivity meter
The original approach, the price sensitivity meter (Van Westendorp 1976), asked four questions about the respondent’s perception of expected prices.
- At what price would this product be so cheap that you would doubt its quality and not consider it? (called the “too cheap” price)
- At what price would this product be a bargain – a great buy for the money? (called the “acceptably cheap” price)
- At what price would this product seem expensive, but you would still consider buying it? (called the “acceptably expensive” price)
- At what price would this product be too expensive for you to consider? (called the “too expensive” price)
The four pricing questions above directly ask respondents to tell us their “too cheap,” “cheap,” “expensive” and “too expensive” price points. It only takes a minute or so for respondents to answer, so it’s indeed quick and easy.
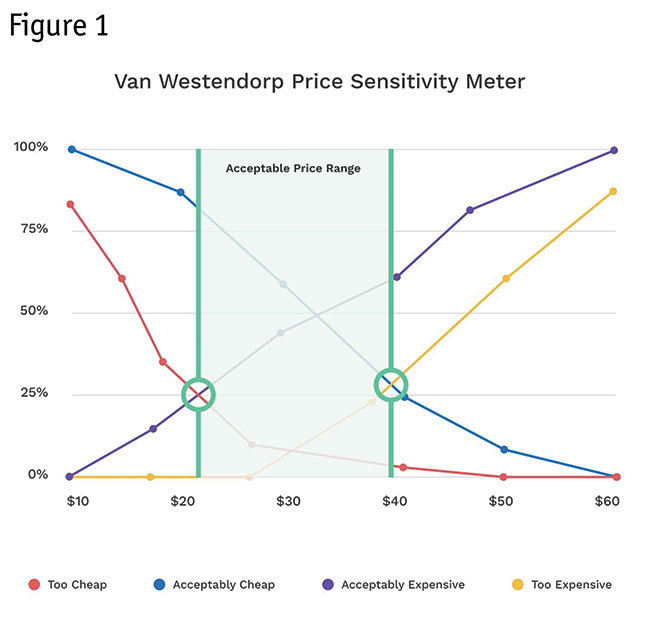
Van Westendorp proposed that a plot of the four curves (cumulative percent of respondents) could diagnose the acceptable price range for a product (shown in green shading). Other intersections (inside the green shading but not highlighted here) would indicate what Van Westendorp called optimal and ideal price points. In the chart in Figure 1, for example, the percent of respondents who think $20 is “too cheap” is 25%. The percent who think $40 is “too expensive” is 28%.

The Van Westendorp PSM approach lacks a clear link with likelihood of product choice but the Newton-Miller-Smith purchase intent extension (Newton et al. 1993) adds two five-point-scale purchase intent questions (“definitely would purchase” to “definitely would not purchase”) asked at the two middle prices (acceptably cheap and acceptably expensive) and lends more credibility.
With the Newton-Miller-Smith extension, for each respondent we can create a demand curve (with purchase likelihood) at each of the four price points. To do so, it’s typical to discount the purchase likelihood (on the responses to the two interior price points) with likelihoods such as:
- Definitely would purchase: 70%
- Probably would purchase: 25%
- Might or might not purchase: 10%
- Probably would not purchase: 0%
- Definitely would not purchase: 0%
(These calibrated likelihoods could be adjusted, given more knowledge of the particular product category.)
Newton-Miller-Smith originally proposed that the purchase likelihood at the “too cheap” and “too expensive” points should be set to 0% for each respondent. However, it seems more reasonable (following economic theory) to believe that purchase likelihood for the “too cheap” price should be modestly higher than the respondent’s purchase likelihood at the “acceptably cheap” price (Orme 2016, Shan 2021). After all, it wouldn’t take long for buyers to see reviews and reports that a product they initially thought seemed too cheap indeed was delivering good value for the money.
Consider the derived demand curve shown in Figure 2 for a respondent who gives PSM prices of $20, $28, $37 and $45 for the four price points; and for the N-M-S extension indicates “definitely would purchase” at $28 and “probably would purchase” at $37.
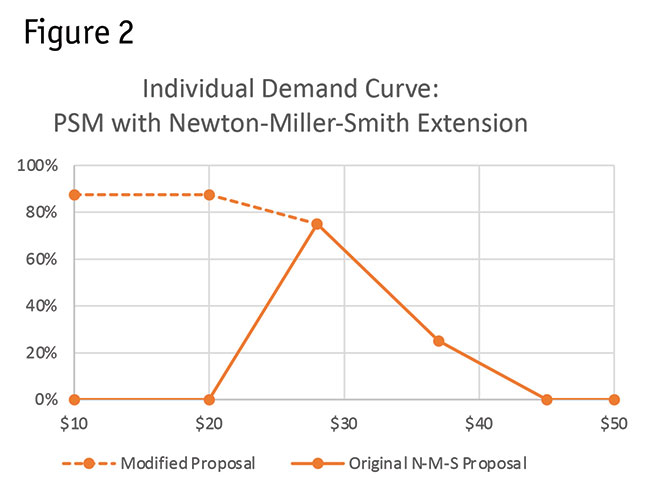
Averaging the demand curves across respondents leads to a market-based demand curve, further allowing us to derive a total revenue curve by multiplying price by purchase likelihood at each point along the price continuum. The modified proposal with the dotted line (avoiding the upward sloping portion of the demand curve, per economic theory) leads to modestly lower recommendations for optimal price points compared to the original N-M-S proposal.
The Van Westendorp PSM approach lacks grounding in economic theory for finding the optimal price point. It’s somewhat like reading tea leaves to think that the ideal price should be determined by an intersection of cumulative plots of the four price-point questions. The Newton-Miller-Smith extension improves the approach. However, even with the N-M-S extension, the respondent’s purchase intent ratings are typically not being made in a realistic competitive context.
Furthermore, the approach is limited to typically studying just a single or very few variations of a product concept. For brand-new-to-the-world products without an easily established competitive context, this approach could be a good first step. But conjoint analysis is generally better and indeed could be used as a more rigorous follow-on study.
Gabor-Granger approach
This approach involves asking respondents if they would buy a product at a given price (Gabor and Granger 1966). If they say yes, then we ask the question again at a higher price. If they say no, then we ask the question again at a lower price. As with the PSM approach, it takes very little time to answer these questions. But there are also multiple problems with this approach. For example, no relevant competition is typically shown to provide adequate context. Moreover, the price point we begin asking the respondent about strongly biases the outcome.
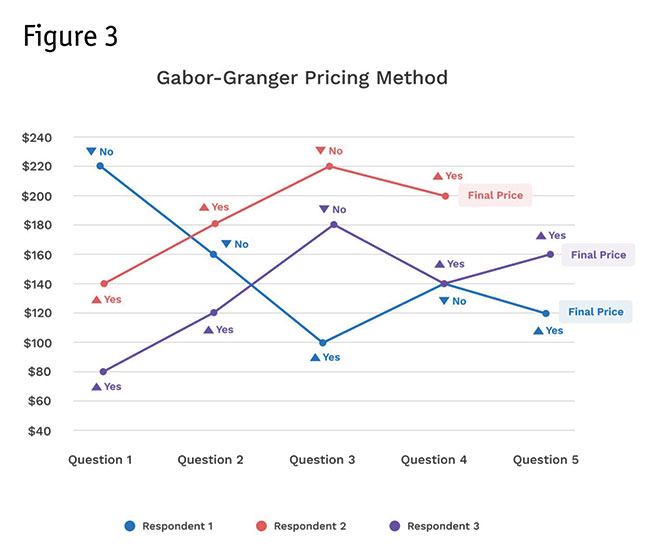
The chart in Figure 3 shows outcomes for three representative respondents. Averaging across all respondents leads to a market-based prediction of the demand curve, with the same possibilities for deriving a revenue curve as the Van Westendorp (with N-M-S extension) approach.
With the Gabor-Granger approach, it’s clear to the respondent that this is a pricing game. This, in our opinion, harms the perception of realism and can lead to biased results. As with the Van Westendorp PSM approach, the respondent usually is not comparing the test product against relevant competition and the approach is limited to typically studying just a single or a very few variations of a product concept. In short, we cannot think of a good reason to recommend the Gabor-Granger approach.
Why has conjoint analysis pricing research become widely accepted?
A big weakness of the above approaches is they try to determine pricing for usually just one or a very few versions of the product concept, not thousands or millions of variations like conjoint analysis can deftly handle.
Conjoint analysis pricing research has become a widely accepted and trusted method because the conjoint survey experience creates a more realistic environment where the respondent makes choices (and can price-compare) truer to what they see and do in the real world. Figure 4 shows an example conjoint analysis question.
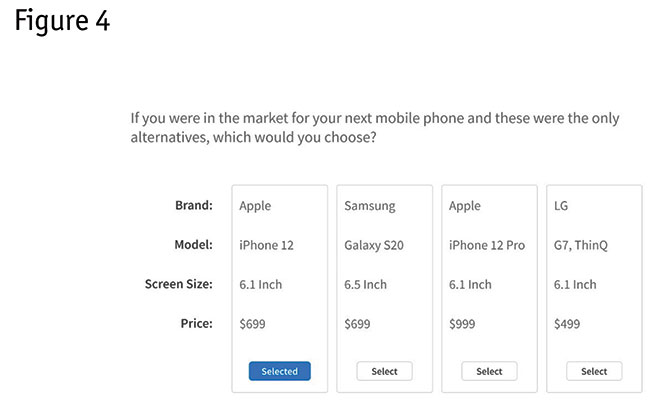
Conjoint analysis questions systematically vary the features shown and their prices and respondents pick which product they’d most likely choose in each carefully rotated scenario.
Based on how respondents react to price and other feature changes, we can more reliably fit a model (typically hierarchical Bayesian logistic regression) that reveals their price sensitivity (price elasticity) and willingness to pay (WTP). Or, in other words, we can learn how quantity demanded changes with changes in price.
Conjoint analysis takes more effort in the planning (developing an appropriate list of attributes and levels to cover the firm’s product as well as relevant competition) and requires a higher level of experience along with widely available statistical tools to analyze than the simpler approaches previously discussed. For respondents, it takes about three to eight minutes to complete a conjoint analysis survey. Sample sizes are sometimes larger than one would use for the other two methods mentioned here but usually in the range of 300 to 800 respondents. It requires more in-depth thinking on the part of the respondent (which is a good thing), more akin to the making purchase decisions in the real world.
If it isn’t obvious yet, we think the endeavor is well worth the effort and investment. If you’d like to experience a conjoint analysis survey and see how it estimates price sensitivity curves and leads to a what-if market simulator, we recommend you take an example survey with real-time results at www.sawtoothsoftware.com/baseball. The example conjoint study takes you through a sample conjoint questionnaire, asking about your food preference at a baseball stadium and then lets you review the results based on the cumulative data from all survey responses gathered.
Why conjoint has become more valuable
Conjoint analysis has become valuable over the decades for marketers and pricing managers due to the intuitive usefulness of the market simulator.
The simulator is like a voting machine, where the manager can specify a competitive market scenario (involving the manager’s product vs. relevant competition) that interactively yields a market share-type prediction (called “share of preference”).
This market simulator often is in Excel or in a web-enabled application. You specify different features and prices for your product (as well as for its relevant competition), run the market scenario simulation and see the predicted share (share of preference).
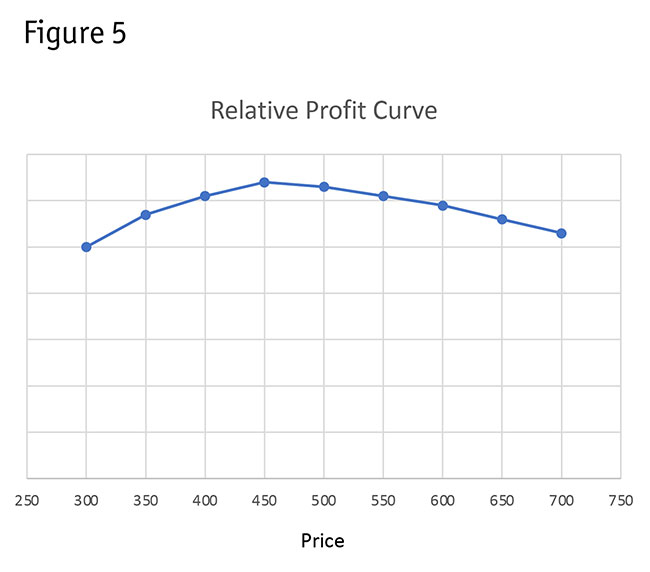
The market simulator shows how raising or lowering price (relative to your competitors) changes the predicted share, revenue and profits. To predict profits, you also need to tell the simulator how much it costs to produce your product.
For example, Figure 5 shows a profit optimization curve as revealed by a conjoint analysis market simulator.
We can even use market simulators to search for optimal prices and features for tiered product-line offerings, such as gold, silver and bronze levels.
Effective pricing research method
Choice-based conjoint (aka discrete choice experiments, Louviere and Woodworth 1983) has been employed by academics and practitioners for decades and there are a variety of both commercial and open-source tools available. Because choice-based conjoint shows respondents sets of competing products with realistic features and price ranges similar to how buyers see and evaluate products in the marketplace, CBC is an effective pricing research method.
A strength of CBC is that we do not need to assume each brand has the same price sensitivity. Depending on the brand’s reputation and brand equity, price elasticity can and should differ.
CBC’s experimental design permits efficient estimation of brand-specific price curves. In some circumstances, measuring price sensitivity uniquely by brand can lead to more accurate pricing decisions and optimization.
Unmotivated respondents or bad actors (cheaters) are a problem in survey research. This is especially a concern with pricing research. If you have respondents who randomly answer conjoint questions, it can make it look like people are willing to pay much higher price than real buyers would.
Fortunately, conjoint analysis leads to an individual-level goodness-of-fit statistic to help you prune the bad actors. You should also use speed checks and quality-of-open-end-question checks to clean the data and obtain better pricing research insights.
The Sawtooth Software Conferences give companies an opportunity to talk about how they use conjoint analysis for pricing decisions and optimizing profits/revenue. Some recent examples include:
- Microsoft: Researchers at Microsoft’s peripheral division used conjoint analysis to figure out the right price to charge for improvements to their products. They also demonstrated how conjoint analysis simulators can be used to optimize a product line involving multiple products.
- Procter & Gamble: P&G’s researchers compared conjoint analysis to econometric models they’ve built from real market purchase data. On average, they found good correspondence between price sensitivity measured by conjoint analysis compared to real market data.
- Lifetime Products: Lifetime’s researchers were able to convince a big-box retailer that Lifetime’s utility chairs and tables could command and deserved a price premium using findings of conjoint analysis studies.
- Amazon: Researchers in Amazon Devices have found that conjoint analysis can help them predict product launch success across multiple markets.
We mentioned earlier the importance of trying to make a pricing research survey resemble the real buying process. At the 2013 Sawtooth Software Conference, Fuller and Buros described a realistic-looking menu-based conjoint analysis pricing study conducted for HomeAway, a residential-based home-booking service for travelers, later bought by Expedia. Even though the questionnaire clearly stated to respondents that they were making hypothetical choices of home bookings, the researchers reported that “HomeAway received numerous calls from its subscribers asking why their ‘choices’ in the task had not appeared in their listings.” HomeAway implemented the pricing recommendations gleaned from the conjoint analysis study and the researchers reported, “Average revenue per listing increased by roughly 15% over the prior year” (Fuller and Buros 2013).
Worth the thought and effort
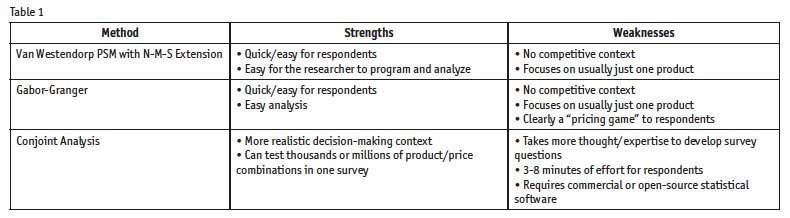
We’ve summarized the strengths and weaknesses of the different survey-based pricing approaches covered in this article in Table 1. Although conjoint analysis is more challenging for both the respondent and the researcher alike, the results are well worth the additional thought and effort.
References
Gabor, A., and Granger, C.W.J. (1966). “Price as an indicator of quality: report on an enquiry.” Economica, 33(129), 43. doi:10.2307/2552272.
Louviere, J.J., and G.G. Woodworth (1983), “Design and analysis of simulated consumer choice or allocation experiments: An approach based on aggregate data.” Journal of Marketing Research, 20:350–367.
Newton, D., Miller, J., and Smith, P. (1993), "A market acceptance extension to traditional price sensitivity measurement." Proceedings of the American Marketing Association Advanced Research Techniques Forum.
Orme, B. (2016), “Van Westendorp price sensitivity meter (PSM) Templates.” Downloaded from: https://sawtoothsoftware.com/resources/software-downloads/tools/van-westendorp-price-sensitivity-meter.
Shan, M. (2021), “Enhancement of Van Westendorp price model via newer statistical approaches.” 2021 Sawtooth Software Conference. Provo: Sawtooth Software.
Van Westendorp, P. (1976) "NSS-price sensitivity meter (PSM) – A new approach to study consumer perception of price." Proceedings of the ESOMAR Congress.