Editor's note: Erwin Chang is CEO of research firm Bloommark.
Multipacks have become an essential part of any CPG marketing plan. They have the potential to create customer loyalty and serve a segment of the population that tends to buy in large quantities. Moreover, in the U.S., sales of some consumer goods categories are based primarily on multipacks, such as toilet paper, tea bags, fresh eggs and alkaline batteries.
The right multipack set should create happier customers, boost sales, stimulate consumption and reduce production costs by limiting product cannibalization within multipacks. Optimizing the multipack portfolio is a win-win situation.
But there are two basic questions that brand managers, and even those higher up, struggle to answer when reviewing their product portfolio: Does my brand have the right number of multipacks? And, do my multipacks have the correct number of units per pack?
Thankfully, there is a statistical technique that is designed to tackle these questions: multisize product analysis for consumer goods (MPAC). This article will describe some key data from a study of multipack customers and explain in detail how MPAC can help brands conceive the ideal multipack portfolio. (MPAC is a proprietary research tool developed by me and owned by my firm, Bloommark, but all interested parties are encouraged to use it for their personal benefit at no cost. However, companies or individuals who wish to use the tool for commercial purposes must contact Bloommark for permission.)
Very appreciable
The population that tends to buy multipacks is very appreciable. In a recent study conducted on people who buy groceries at least once a month at brick-and-mortar stores, around 48% of interviewees mentioned that they buy multipacks during their grocery shopping trips. (This question may not consider occasional purchases and purchases at other sales points beyond grocery stores.)
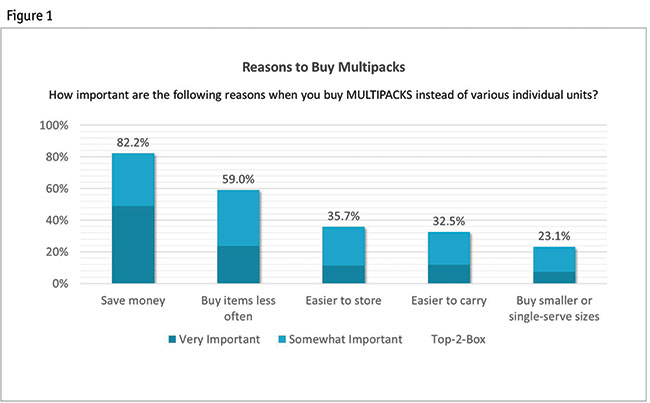
Price is the top driver behind the decision to buy multipacks. As seen in Figure 1, in a five-point scale question, 82% stated that saving money is either an “extremely important” or “very important” reason to buy multipacks. After price, the next most important factor that drove multipack purchases was customers’ desire to “buy items less often.” Almost six out of 10 interviewees considered this extremely or very important.

Less than half of respondents rated other reasons, such as “easier to carry” and “easier to store,” as extremely important or very important.
Interestingly, the study also found that some food categories do not satisfy the multipack demand at grocery stores (excluding warehouse clubs, online retailers and convenience stores). For example, around 70% of multipack customers who buy canned beans or spaghetti have mentioned that they would definitely or probably purchase those products in multipack format if available at grocery stores.
Using statistical analysis as its foundation, the MPAC aims to provide CPG companies with the right multipack portfolio (the number of units per multipack and the number of different multipack sizes) to reach and satisfy the largest customer base. The MPAC answers the questions about how many multipacks to include in a portfolio or set and which multipack sizes (number of units per multipack) to offer. Whether a company wants to launch multipacks for the first time, add multipacks, reduce the number of multipacks or just optimize the current portfolio, the MPAC is designed to provide the answer.
One of the main criteria to optimize the multipack sets is the reach that the set may have. Essentially, the reach is an estimate of the percentage of shoppers who would buy a multipack from a given set of multipacks. Other essential factors are also taken into account.
Unlike other approaches, the MPAC doesn’t consider a predefined group of multipacks in terms of multipack sizes (e.g., a six-pack, a 12-pack, a 24-pack, etc.). Instead, it analyzes all possible multipack sizes that fall between the minimum number of units and the maximum number of units per multipack that survey respondents would like to have in a multipack (min/max range). This way, the MPAC evaluates thousands of multipack combinations for a specific set size to create a ranking of top performers.
For example, let’s assume that after collecting all responses from an MPAC survey, the smallest multipack size that a respondent would like is a two-pack and the largest multipack size mentioned in the survey is a 48-pack. Also, let’s say that the CPG company that requested the study only wants a set size of four multipacks.
Using a statistical model, the MPAC will measure the market potential of all possible combinations, which, in this case, equal 178,365 different sets (using the statistical formula for combinations C(47,4)). For instance, it will calculate the market potential for Set 1: a two-pack, a three-pack, a four-pack and a five-pack; then, for Set 2: a two-pack, a three-pack, a four-pack and a six-pack; and so on. Of course, the list handed to the CPG company would only include the top sets. (Note: Please do not attempt to calculate the market potential of each possible combination manually!)
In addition, the MPAC will use the same principles to analyze different set sizes. Usually, it is the CPG company that gives the range of sets. For example, a company may specify that it would like to study sets that range from two multipacks to six multipacks.
Furthermore, although this study focuses exclusively on multipack portfolio optimization, the MPAC technique has various applications. One such application involves optimizing multisize unit portfolios, taking into consideration unique variables like individual unit size and packaging. For example, it can show that the best multisize unit portfolio for a beverage comprises a 10-ounce can, a 16-ounce can and a 34-ounce plastic bottle. Thus, the MPAC technique can be useful for CPG companies’ wide-ranging needs.
Survey design
Although the MPAC survey has a well-delineated structure, some adjustments are necessary depending on strategic goals. Some common examples of study objectives include: increase consumption from current brand customers, reduce production costs by reducing the number of multipacks and increase market share by offering unique multipacks, among others. Thus, three main survey design variables should be defined according to the main brand goal(s) for the study: respondent target, point-of-purchase segments and purchase purpose.
The respondent or survey target of an MPAC study is determined by consumption patterns. The two most common targets are the brand shoppers and the category shoppers. Large brands, with large penetration levels, usually focus on their own shopper base, as the current repeat shoppers are very valuable, have been gained with much effort and can still provide more growth.
On the other hand, smaller brands, in terms of reach, focus on the category customer for two reasons. One is that small brands prioritize gaining new customers and increasing their market share. Thus, the data that they need for their growth goals is the product category information. The second reason is that it is difficult to recruit shoppers of a brand with a small market presence.
Besides these two standard marketing research targets, other less common target options obey particular brand strategies for multipack R&D.
Since different retail channels attract customers with different needs, the items that brands offer may differ from channel to channel. Accordingly, the multipacks available at one type of retail can vary significantly from those found on another channel. For instance, the multipacks at Costco would most likely have more items or larger unit sizes than the ones available at Whole Foods (e.g., a 16-ounce package instead of an 8-ounce package).
Thus, it is important to take into consideration the different points of sale. For instance, for food and beverage products, there are five main retail channels that have unique characteristics: warehouse clubs, such as Costco; mass merchandisers, such as Walmart; grocery stores (which can be split into traditional and natural stores); convenience stores; and online stores. Nonetheless, it is possible to expand (add drugstores or dollar stores) or reduce (merge mass merchandisers with grocery stores) the list according to the product category and research design.
The third variable involves defining and indicating the purpose of the purchase, if necessary. Shoppers may buy different multipack sizes if they are buying for their own consumption or for a party, for instance.
In any case, the MPAC survey must be administered to either current multipack buyers or likely multipack buyers or a combination of both. A single screener question, such as purchase intent for the product multipack, can filter eligible participants.
The MPAC questions for multipacks
The MPAC asks three questions that are the pillar of the analysis:
- If you were to purchase multipacks of [CATEGORY and/or BRAND] at [STORE TYPE if applicable], what is the IDEAL number of [UNIT TYPE/PRESENTATION (e.g., 3-ounce glass bottle)] that you would like the multipacks to contain?
- If you were to purchase multipacks of [CATEGORY and/or BRAND] at [STORE TYPE if applicable], what is the MINIMUM number of [UNIT TYPE/PRESENTATION] that you would like the multipacks to contain?
- If you were to purchase multipacks of [CATEGORY and/or BRAND] at [STORE TYPE if applicable], what is the MAXIMUM number of [UNIT TYPE/PRESENTATION] that you would like the multipacks to contain?
If necessary, the questions may also include a purchase purpose specification (e.g., “If you were to purchase multipacks of beer at a gas station for a party…”), as explained in the previous section.
The three questions are very important, as it is not only crucial to know the shoppers’ minimum and maximum multipack size range (min/max range) but also which exact size is his/her favorite. The importance of knowing the ideal multipack size will be explained in greater detail in a subsequent section.
Also, these questions are suitable for any type of data collection method, including CATI, online questionnaires and PAPI, without the need to modify them.
Notice that the questions do not use a purchase intent condition connected to the number of units asked but rather a liking one (for example, ending the question with “that a multipack should have for you to buy it” rather than “that you would like the multipacks to contain”).
Our research suggests that including the purchase intent condition leads respondents to provide a wider range of size options (defined as the min/max range) as opposed to just asking for what they “would like” the multipack to have. In fact, using a purchase intent condition may provide options that are unreal, as the shopper may be willing to buy some of the multipacks only under extreme situations (such as when there is no other choice in the store, for example).
The three MPAC questions should be administered using the following recommendations. The first one is to avoid using multiple-choice alternatives and instead require the respondent to write (or say) the answers. Multiple-choice questions work well when the number of multipack sizes (options) is not very large. However, they aren’t as effective when the options are more substantial. Moreover, using the multiple-choice alternatives leads respondents to use a specific range and may also hide potential multipack sizes that are not in the options. Additionally, if answering the survey online, writing the numbers will force respondents to read the questions and respond more thoughtfully, instead of randomly selecting any option.
If conducting online surveys, it is recommended not to combine the MPAC questions with other questions on the same page. As well, it is also advisable to apply validation options, such as allowing only positive integers as answers and verifying that the minimum number of units is equal to or lesser than the maximum.
The last recommendation is to carefully clean the data if there are no validation options in place. Some respondents will write a minimum number of units that is higher than the maximum number or write an ideal number that is outside the min/max range.
Analysis
In this account, the analysis and KPIs will be described using real data obtained in one of our studies for the toilet paper category. When processing and cleaning the data, only multipack sizes that could be accommodated in a convenient cuboid shape were taken into account. For example, multipack sizes such as 62-roll multipacks were discarded (the only way to accommodate 62 rolls in a cuboid shape is in a 2x31-roll multipack package, which will be very inconvenient for shoppers to carry). Other categories, such as the chocolate candy category, do not present this type of problem because its boxes or plastic bags can accommodate any (reasonable) number of candies.
Once the survey data is collected and processed, the MPAC technique provides two main types of analysis: the net-reach maximization and the portfolio-size optimization.
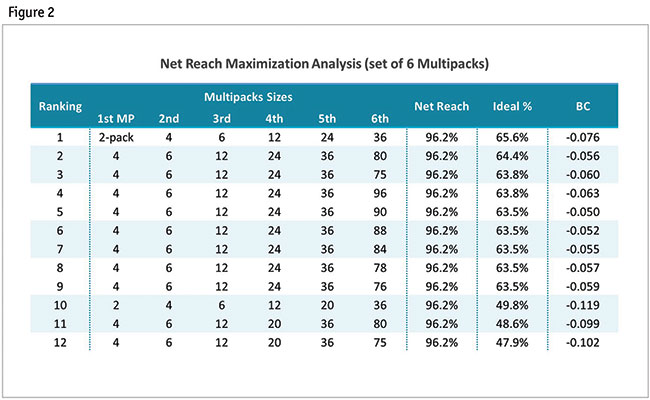
The net-reach maximization (see Figure 2) refers to analyzing multipack combinations for a specific set size. This is the most important analysis when companies try to define the multipack sizes that their portfolio must have. The analysis table provides a ranking with the top multipack combinations and their KPIs – net reach, ideal-size reach and coefficient of balance. These KPIs are described in more detail below.
The net reach is defined as the total penetration measured for a set of multipacks that excludes duplicate counts. For instance, a net reach of 33% means that one-third of the shoppers studied would find at least one multipack, in a given set, containing the number of units they would like a multipack to have.
The net reach is calculated using what is called the min/max range of each respondent. The min/max range is, in turn, based on the answers to the second and third MPAC questions regarding the minimum and maximum numbers of units that the shoppers would like a multipack to have.
The net reach indicator is one of brand managers’ main priorities. It is usually the first indicator reviewed, as satisfying the multipack needs of a larger group means more sales and more market share. Moreover, the net reach is the primary factor used to sort the sets for the net-reach maximization analysis.
The ideal-size reach (ideal % or ISR) is in the penultimate column of the net reach maximization table. It represents the percentage of customers who declared that their ideal number of units for a multipack is provided by one multipack of a given set. For example, if the ideal-size reach is 50% for a multipack portfolio, it means that half of the shoppers found their ideal multipack size among the multipacks of that set.
The ideal-size reach indicator (before the last column) is the second KPI used to sort the net-reach maximization analysis ranking. It is crucial for the analysis if the net reach estimates are the same or quite close among sets. For example, as you can observe in Figure 2, it is not uncommon to find various multipack sets with the same net reach for a given set size (in this case, six multipacks per set). This phenomenon happens when analyzing medium or large sets (with five or more multipacks, for example) and the product category comprises a wide range of single multipack alternatives (toilet paper multipacks vary from two rolls to 80 and more!).
The ideal-size reach is important for at least two reasons. First of all, a higher ISR produces a higher satisfaction level when comparing two sets with the same net reach, according to various products studied. For instance, speaking about a related product category, 98% of paper towel shoppers mentioned that they were either very satisfied or somewhat satisfied (top two-box) when buying a paper towel multipack that contained their ideal number of rolls. On the other hand, only 78% said they were at least somewhat satisfied when buying a paper towel multipack containing the minimum number of rolls they would like a multipack to have.
A common pattern shared in many product categories is that the satisfaction ratings related to buying a multipack that has the maximum number of units that a shopper would like are usually higher than the satisfaction ratings for the minimum size but, of course, lower than the satisfaction ratings for the ideal size.
More importantly, a higher ideal-size reach also means more sales. This is true after conducting purchase intent and scenario-based (vs. competition) multiple-choice inquiries that compare multipacks that fall into their min/max range but do not necessarily have the respondent’s ideal number of units. It means that some shoppers will prioritize their ideal multipack size over their favorite brand in many cases.
Nonetheless, the ideal-size reach varies in importance depending on the product loyalty level. According to our product loyalty ranking, the purchase intent of products with the lowest loyalty ratings is very susceptible to changes in the ideal-size reach estimates and vice versa. On the one hand, some product categories, such as bottled water, which has a low product loyalty (due to low-cost private-label brands), show that shoppers are willing to switch brands based on the multipack size.
On the other hand, the pattern of switching brands in order to buy the preferred multipack size is virtually nonexistent in some other categories, such as the deodorant category, which enjoys the highest product loyalty rating of over 30 categories tracked.
The last indicator for the net-reach maximization analysis is the balance coefficient (BC) (last column in Figure 2). This is the third factor used to sort the net-reach maximization analysis. It is a way to analyze the shopper distribution among the minimum and the maximum number of units that he/she would like a multipack to have. It helps to indicate how well-balanced the set is according to shopper preferences. The BC is a number between -1 and 1. It is the average of all potential shoppers’ BCs.
The main three cardinal points are -1, 0 and 1; -1 means that the number of units of a multipack equals the minimum number of units that a shopper would like to have in a multipack. Likewise, 1 means that the number of units in a multipack is at the upper border. And 0 means that the number of units obtained by the MPAC equals the ideal number of units that a customer would like in his/her multipack.
The numbers within -1 and 0, or within 0 and 1, are computed using a linear equation. For instance, a BC of -0.5 means that the number of units of the evaluated multipack falls exactly between the minimum number of units that a customer would like to have in a multipack and his/her ideal point. The calculation only takes one side of the distribution at a time because the BC distribution tends to be asymmetrical.
When analyzing sets, one goal is to have a BC equal or closer to 0, which means that it is well-balanced and may present a high ideal-size reach. However, it is also important that the distribution leans toward the right or upper border (a BC over 0). This is because of two reasons.
One reason is that it is preferred that the customer buys a little bit more than his/her ideal quantity versus a little bit less. Having more product units at home means that they are less likely to run out of the product and, in many cases, it incentivizes a higher consumption level. The other reason is that the multipacks with more units than the ideal number but within the min/max range tend to provide higher satisfaction and purchase intent ratings than the multipacks with fewer units than the ideal point.
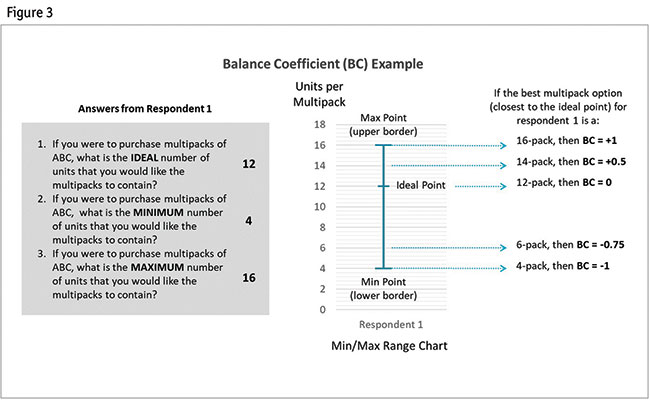
See Figure 3 to see an example of how the balance coefficient is calculated.
The second analysis is the set-size optimization. It is the most important analysis when a brand wants to know if it should increase, decrease or maintain the current number of multipacks. Unlike the previous analysis, this one does not exhibit a ranking but rather a list sorted by the portfolio/set size. For example, the list can start with a set of two multipacks and finish with a set of six multipacks.
The set-size optimization shows only one multipack combination per set or portfolio size. The multipack combination presented is the top one obtained in the net-reach maximization analysis.
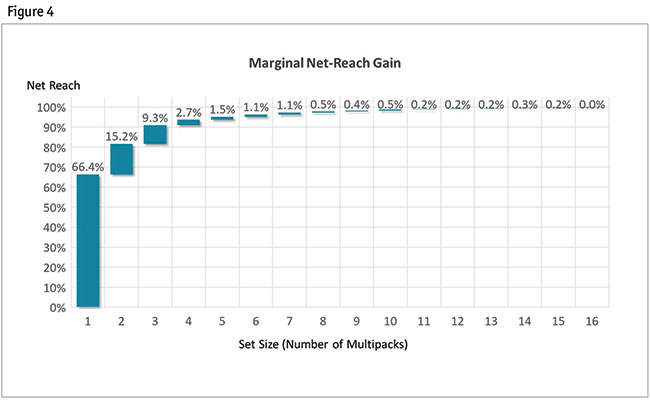
Furthermore, the set-size optimization can also be analyzed using two derived indicators. One is the marginal net-reach gain and the other is the marginal ideal-size-reach gain. The marginal net-reach gain reports the percentage of net reach gained when the number of multipacks of a set increases by one unit. In Figure 4, the marginal net-reach gain is presented using a waterfall chart.
Accordingly, the marginal ideal-size-reach gain presents the percentage of ideal-size reach gained when the number of multipacks of a set increases by one unit. This indicator becomes very important when brands focus not only on increasing the net reach but also the ideal-size reach.
Still not enough
Having the right multipack portfolio is a big step for a brand but still not enough for a successful story. Pricing (remember, it is the most important reason to buy multipacks!), distribution and multipack package design are part of the final steps. Other factors, such as manufacturing capabilities, may play a role in the success of multipacks as well.