Editor's note: Michael S. Garver is professor of marketing at Central Michigan University, Mt. Pleasant, Mich.
In boardrooms all over the world, executives want to know what product and service attributes and features are most important to customers. With this information in hand, executives can tailor their offering to best meet the needs of customers to gain a competitive advantage in the marketplace.
There are a number of marketing research techniques available to help practitioners prioritize the importance of attributes, yet many of these research techniques have serious flaws and limitations. Chrzan and Golovashkina (2006) examined a number of the common research methods for eliciting attribute importance and they suggest that commonly-used methods such as stated importance or preference rating scales have severe limitations and often result in biased and misleading results. Rank-ordering and constant sum are intuitively appealing, yet these methods prove to be difficult when the list of attributes exceeds five or seven, which is often the case for research practitioners. These researchers suggest that maximum difference scaling and Q-sort are the best research methods for prioritizing the importance of attributes.
Chrzan and Golovashkina (2006) suggest that Q-sort is an excellent research method for gathering customer preferences for a long list of potential customer needs or proposed product features. These researchers found that Q-sort outperformed all research methods except for maximum difference scaling. At the same time, Q-sort took the least amount of customer time to complete the survey, whereas maximum difference scaling took the longest time to complete. In addition, maximum difference scaling can only be implemented with special software which may not be available to all researchers. In short, Q-sort is an excellent alternative to maximum difference scaling. However, Q-sort makes the assumption that all attributes in the exercise are important to all respondents. If this assumption is not valid, then the results can be very biased and misleading.
The author was working with a software company where this assumption was not valid. As a result, the author developed and implemented a simple but effective approach called adaptive Q-sort, which ensures that all features in the exercise are relevant and important to all respondents. The purpose of this article is to introduce adaptive Q-sort and to discuss how to implement it.
Q-sort
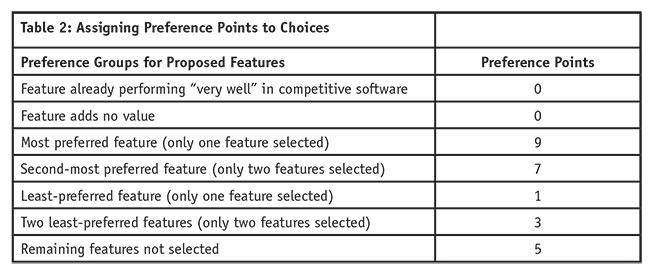
Q-sort imposes a quasi-normal distribution onto customer preferences by asking customers to place different features into different preference groups, with each group having a different level of preference. For example, if the researcher wanted to examine preferences of 10 features, the customer would place a specific number of features into five different categories of preference (1-2-4-2-1), with each category getting a different number of preference points. For example, the customer would have to select the one proposed feature that is most preferred and this feature would receive five points. Then, the customer would select the two proposed features that are second-most preferred and these features would receive four points. Then, the customer would select the four proposed features that are third-most preferred and these features would receive three points, followed by the customer selecting the two proposed features that are fourth-most preferred, which would get two points. Finally, the customer would select the one proposed feature that is least-preferred and this feature would receive one point. Q-sort imposes trade-offs into the prioritization process, which is a desirable characteristic.

Assumptions and limitations of Q-sort
Like any research method, Q-sort has certain assumptions and limitations. Q-sort imposes a normal distribution on the data that may or may not be appropriate. In most situations, researchers will not know the distribution of customer preferences until the research is complete. Related to this assumption, Q-sort assumes that all features in the study are actually relevant and important to all customers. If these assumptions are violated, then the results may be biased and skewed.
These assumptions can be troublesome in some situations. Anecdotal evidence suggests that practitioners often explore a large number of new potential product features that are simply not important to all customers. There is tremendous pressure on brand managers to strengthen or maintain a product’s competitive advantage, which influences brand managers to constantly improve and add new product features. As a result, a large number of proposed features are tested with customers and experience suggests that not all customers place value on all of these new product features.
From a segmentation perspective, it is common that the marketplace will typically have a “basic needs” segment, which values basic performance at a low price. These customers will likely prefer basic features that support the basic functions of the product, thus keeping the price low. Many new proposed features may not be important to this group.
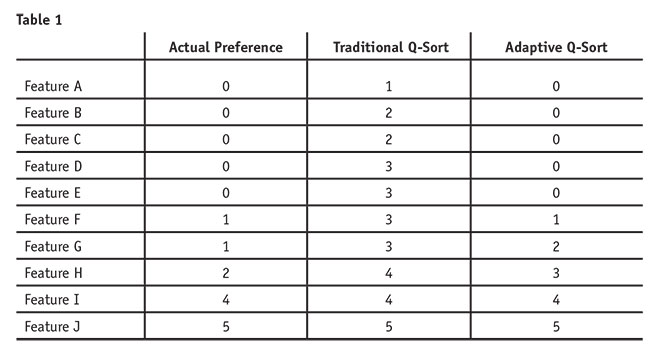
To examine the potential problem of this assumption being violated, imagine the following scenario for a single respondent (see Table 1). Assume that five of the 10 features are not relevant or important to this respondent. Concerning the respondent’s actual preferences, only five of the 10 features have preference scores, ranging from 1 to 5. Clearly, the actual preference scores for this respondent do not have a normal distribution.
Implementing traditional Q-sort, the customer is forced to give some level of preference to each feature. In our example, the customer would be forced to give Features A through E a preference score between 1 and 3, when in reality these features have zero preference. To improve this approach, the researcher needs to remove those features from the traditional Q-sort exercise before the exercise begins. In short, product features that have no preference for a given customer should not be allowed to enter that customer’s Q-sort exercise.
Adaptive Q-sort does exactly that; it removes the features with no preference from the Q-sort exercise before it ever begins. To enter the adaptive Q-sort exercise, the features must have some level of preference for that customer. As displayed in Table 1, adaptive Q-sort does not perfectly capture the preferences either because the data do not have a normal distribution. However, there is much less error as compared to a traditional Q-sort approach. We propose that adaptive Q-sort is advantageous to traditional Q-sort and can be completed with basic survey creation software that contains advanced skip logic capabilities.
Research context
Adaptive Q-sort was implemented for a software product that was early in its product life cycle and had relatively high switching costs (time, effort and financial resources) for its customers. To meet company objectives for growing revenue and market share via new customer acquisition, the management team wanted to examine how to improve their software with the specific goal to acquire customers of their key competitors.
From a product life cycle perspective, the original software product started off by being a database software solution with basic features. As time progressed, managers of the software product became conflicted over the software’s current and future roles. For example, some managers argued that the software solution should stick to its current capabilities (a database software solution) and just improve them. These managers argued that more specialized software solutions existed and could be integrated with their software solution. Anecdotal evidence suggested that a group of customers agreed with these managers. Yet other managers argued that the current role should be expanded to include these new software features and to become a one-stop software solution for customers. Here again, anecdotal evidence suggested that a group of customers wanted current software capabilities to be greatly expanded and to include these new software features. For this group of customers, it was unclear as to which features were most preferred.
High switching costs associated with this software also influenced the research process. Given their insight into the marketplace and the influence of high switching costs, management only wanted to pursue proposed features that were not being addressed or performing well in competitive software solutions. This was critically important to the management team.
In light of their current situation, the researchers expected that some of the proposed features would be irrelevant to certain customers. For these reasons, traditional Q-sort was ruled out. The researchers also discussed implementing maximum difference scaling but they thought that it would take too much time and effort from customers.
Research methodology
To meet the research objectives, adaptive Q-sort was developed and implemented using advanced skip logic within Qualtrics survey software. In the adaptive Q-sort exercise, it started by introducing and explaining the proposed software features so that respondents would understand their meaning and application. Respondents were then asked to identify those software features that their current software solution already performed “very well.” If the software feature was selected, then it was removed from the adaptive Q-sort exercise. If the software feature was not selected, then it was carried forward into the next step of the adaptive Q-sort exercise. At this point in the adaptive Q-sort process, proposed software features were removed from the exercise if the feature was performing “very well” in their current software or if the feature added “no value” to the software.
The survey then asked respondents to confirm their prior choices. For example, “Earlier, you selected the following features that your current software is performing very well. Is this correct?” On the next page, the following question was asked: “Earlier, you chose the following features that would add no value if added to your current software. Is this correct?” Finally, customers were presented with proposed features that by the process of elimination should add value to the software and they were asked to confirm that these features indeed would add some value if included into their software. If these three questions were confirmed, the respondent then went into the Q-sort exercise. If these questions were not confirmed, then the customer was removed from the database. Implementing this approach, the researchers were confident that each customer’s Q-sort exercise would only include features that were relevant for that individual.
The survey was pre-tested with managers as well as a small number of actual customers. After a number of revisions, the final survey was sent via e-mail to 3,000 respondents, who were all end-users for this type of software. The e-mail invitation contained a password-protected link to take the survey. From this activity, 2,428 e-mails were successfully delivered and 622 respondents started the survey. After rigorously cleaning the data, 490 respondents with complete and quality answers remained in the sample, for a clean response rate of 20 percent.
Preference points were then assigned to the customer’s actual survey choices. See Table 2 for how the researchers gave preference scores to customer selections concerning the proposed features.
Results
Due to the sensitive nature of this research, the author has disguised the actual name of the proposed software features. There were basically two types of software features. One type of feature dealt with achievement, while another type of software feature dealt with efficiency. Thus, the software features are named in this article Achievement A through I and Efficiency A through G.
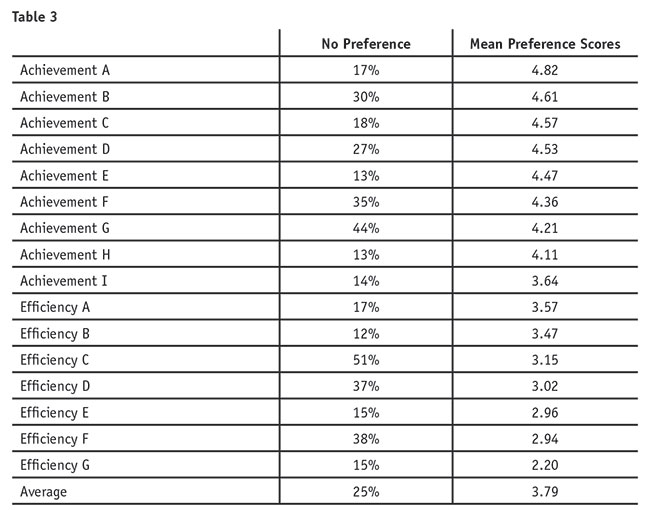
Proposed software features with no preference. Given the survey logic implemented for each software feature, the analysis started by examining the percentage of customers who placed “no preference” on the proposed software features. For ease of interpretation, “no preference” scores are the combined percentage of customers who stated that their current software is already performing these features “very well” or the feature adds “no value.” Table 3 suggests that on average, 25 percent of customers placed “no preference” on the proposed software features, with the range of features having “no preference” being from 13 percent to 51 percent. The majority of customers (85 percent) selected at least one software feature as having no preference, while only 2 percent of customers placed no preference on all proposed software features.
Management’s assumption that many of these proposed software features would be irrelevant to a large number of respondents was correct. Thus, the decision to implement adaptive Q-sort was justified. For example, over half of the survey respondents placed no preference on the proposed feature Efficiency C. If traditional Q-sort had been implemented, these respondents would have been forced to place some preference on this feature, when in fact there was none.
Preference scores. The preference scores for the proposed software features range from 2.20 to 4.82, with an average preference score of 3.79 (Table 3). Overall, there is good variation in the preference scores. Clearly, the marketplace strongly prefers the Achievement software features as compared to the Efficiency features, as all of the Achievement software features have higher preference scores than the Efficiency features.
Interesting to note, some of the features that had a large percentage of customers stating “no preference” also had relatively high preference scores. For example, the Achievement B feature has a higher than average percentage (i.e., 30 percent) of “no preference” yet this feature has the second-largest preference score. Likewise, Achievement G feature has a much higher than average percentage (i.e., 44 percent) of customers stating “no preference” yet also a higher than average preference score. For both of these features, there is a relatively large percentage of customers who place no preference at all on these features yet other segments of customers place much higher than average preference on them. In contrast, Efficiency G has a lower than average percentage of customers who place no preference on this feature yet Efficiency G also has the lowest preference score. This suggests that customers have widely varying preferences for these features and that different preference-based segments may exist in the marketplace.
Advanced analysis
While discussing more advanced analysis in detail is beyond the scope of this article, it is important to note some advanced analysis results to demonstrate the usefulness of adaptive Q-sort. Advanced analysis consisted of preference-based segmentation and competitive analysis.
Concerning preference-based segmentation analysis, three segments were discovered after conducting latent class cluster analysis. In short, there were two different types of achievement segments, with both placing significantly different amounts of preference on different achievement features. In addition, there was a smaller efficiency segment who placed higher preference scores on the efficiency features relative to the achievement features. Preference-based segmentation analysis helped the management team to better understand different groups of customers and what combination of features might be bundled together to meet the needs of a specific segment.
Competitive analysis also proved to be quite interesting. In this analysis, the researchers examined preferences for customers of each competitor. For some key competitors, their customers had significantly different preference scores for different software features. Once this analysis was completed, the researchers then conducted CX analysis for each group of competitive customers, with the end result being a “likelihood to defect” index score. In short, competitive analysis examined which competitive customers were most likely to defect and then which new software features their customers preferred most. The key takeaway from this analysis suggested that different strategies would result for targeting different competitive customers.
Limitations and future research
As with any method, there are limitations that need to be addressed in future research. While the researchers were pleased with the results, future efforts should examine possible improvement opportunities. For example, respondents were presented with a long list of proposed software features to start the exercise. After introducing and describing these features, customers were then asked to select the features that their current software solution already performed very well, followed by which software features added no value if they were added to their current software solution. For the first question, 16 software features were listed. Were too many features presented at one time? Should a smaller number of features have been shown for each question? In short, what is the optimum number of features that should be shown to a customer at one time?
In our research study, features that were already being performed well by a key competitor were removed from the Q-sort exercise. Given the nature of the software and the industry, this approach worked for this specific situation yet this approach is not generally recommended.
Overcomes the assumption
The purpose of this article was to demonstrate the implementation of adaptive Q-sort as an alternative approach to traditional Q-sort and maximum difference scaling. In short, adaptive Q-sort overcomes the assumption that all features in the exercise are relevant and important to all respondents. In this research study, all features were not important to all respondents, as demonstrated by 13 percent to 51 percent of respondents placing “no preference” on the proposed software features. If researchers have reason to believe that some of the features would not be relevant to customers, then adaptive Q-sort should be implemented. As demonstrated earlier, the preference scores for adaptive Q-sort would be more valid and accurate as compared to traditional Q-sort. It is important to note that adaptive Q-sort does not require proprietary software and can be used with any survey software that allows for advanced skip logic.
Reference
Chrzan, K. and Golovashkina, N. (2006). “An empirical test of six stated importance measures.” International Journal of Market Research, 48(6), 717-740.