
Editor's note: Michael S. Garver is a professor of marketing at Central Michigan University. He can be reached at garve1ms@cmich.edu.
The logic is simple and widely accepted: Managers should focus on and allocate more resources to the product and service attributes that are important to their customers. In CX research, best practice suggests that key driver analysis (KDA) is the best way to get this information. But what if key driver analysis only provides half of the attribute importance story?
For quite some time, researchers have classified attribute importance from at least two different perspectives. For example, the Kano model put forth must-have and one-dimensional attributes, where must-have attributes are those necessary prerequisites or must-have levels of performance to achieve overall customer satisfaction. In contrast, one-dimensional attributes have a linear relationship with overall customer satisfaction, whereas as higher/lower performance in a one-dimensional attribute will lead to higher/lower performance in overall customer satisfaction. In a similar vein, statisticians refer to these relationships as either a necessity or sufficiency relationship. The necessity relationship is like Kano’s must-have, whereas the sufficiency relationship is like Kano’s one-dimensional attributes. Key driver analysis only provides information on the sufficiency relationship and ignores the necessity or must-have relationship.
Dul (2016) created necessary condition analysis (NCA) to statistically detect must-have or necessity relationships and researchers suggest that NCA should be implemented as a complementary analysis to key driver analysis and importance-performance analysis. For example, Garver (2025a) recently put forth the necessity and sufficiency attribute importance index (NSAII), which is created from the results of NCA (necessity) and key driver analysis utilizing relative weight analysis (sufficiency). NSAII provides both sides of the attribute importance story, providing a more comprehensive perspective of attribute importance.
The purpose of this article is to put forth NSAII and to demonstrate this technique for market research practitioners. To accomplish this purpose, fundamentals of key driver analysis utilizing relative weight analysis will be discussed, followed a discussion of NCA. Then, conceptualizing NSAII along with details of calculating this metric will be discussed. Finally, NSAII’s role in importance-performance analysis will be put forth.
Key driver analysis with relative weight analysis
Key driver analysis is an important tool for market researchers, as it delivers critical information surrounding the importance customers place on product and service attributes or features. KDA refers to statistically inferring the importance of attributes that influence a dependent variable (overall customer satisfaction, loyalty, etc.). Over the last two decades, most of the research attention has examined different statistical tools to determine the most valid method for conducting KDA. KDA is often implemented with a large number of attributes that are highly correlated (i.e., high levels of multicollinearity). In this situation, multiple regression can deliver biased results, so researchers suggest that relative weight analysis (RWA) is the most valid and feasible statistical tool for this task. Yet, RWA assumes a sufficiency logic, only providing half of the attribute importance story.
To implement RWA, some researchers use the RWA package within R, an open-source and free software. An easy-to-use alternative is RWA-Web (www.scotttonidandel.com), which is a free online statistical tool created by leading RWA researchers. For more information on implementing RWA via RWA-Web to conduct KDA, the interested reader should see two articles listed in the references section: Garver and Williams 2020 and Garver and Williams 2024.
Results from RWA include an R2 for the model as well as raw and rescaled weights for the attributes. The raw weights are an additive decomposition of the R2, meaning that their summation equals the R2 of the model. The rescaled weights are based upon the raw weights yet are rescaled so that summing these weights would equal 100. Based on this property, the rescaled weights are more intuitive and easier to understand and researchers recommend these to represent attribute importance scores.
Necessary condition analysis
NCA employs a necessity or must-have logic, where the analysis identifies a level of performance in the attribute that is necessary (i.e., must-have) to achieve a certain level of customer satisfaction. NCA identifies non-compensatory relationships, suggesting that if an attribute’s level of performance is not met, then another attribute cannot make up the difference to achieve this level of satisfaction. NCA is a bivariate technique, thus it does not suffer from problems associated with multicollinearity.
Most NCA applications have been utilized as a complement to traditional path modeling techniques (multiple regression, PLS-SEM, etc.). Results suggest that an attribute can be a significant predictor yet not a necessary condition. In contrast, an attribute may be an insignificant predictor yet represent a necessary or must-have relationship. Implementing NCA to assess attribute importance provides a more comprehensive story of total attribute importance.
NCA may be utilized within SmartPLS 4, R or even an online NCA calculator. SmartPLS 4 has an easy-to-use graphical interface and can be used to perform NCA as well as many different statistical techniques. Within R, there is an add-on package (https://cran.r-project.org/web/packages/NCA/index.html) that can be accessed to run NCA. The NCA online calculator (https://www.erim.eur.nl/necessary-condition-analysis/software-and-calculator/) is a free, easy-to-use website designed for less complex analysis and reporting.
While NCA delivers a range of different results, the most relevant results to create the NSAII are NCA effect sizes. Effect sizes evaluate if and to what level a necessary condition is present. General guidelines suggest that large effect sizes are over .3 and represent must-have relationships, while medium effect sizes are from .1 to .3, and effect sizes below .1 are considered small.
Necessity and sufficiency attribute importance index
The necessity and sufficiency attribute importance index combines attribute importance scores from KDA with RWA (sufficiency) with attribute effect sizes (necessity) from NCA. The NSAII produces two different types of results, which include a classification matrix of attributes as well as a specific metric to quantify an attribute’s total importance.
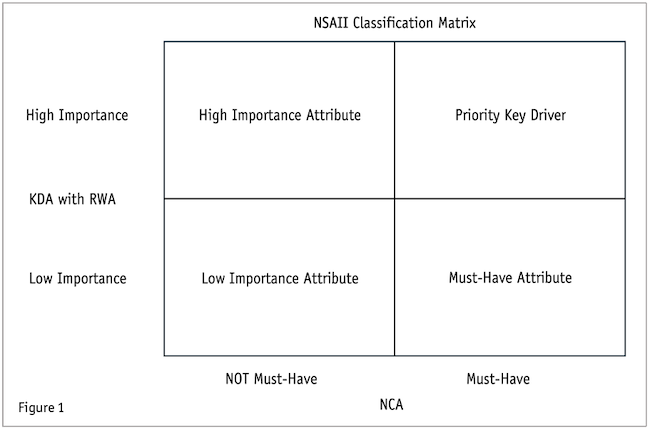
To classify each attribute’s total importance, NSAII input scores (necessity and sufficiency) are plotted on a 2x2 classification matrix (see Figure 1). This matrix has four different quadrants which include priority key drivers, high importance attributes, must-have attributes and low importance attributes. Priority key drivers are those attributes that are relatively high in importance and have large NCA effect scores (i.e., must-have). High importance attributes have relatively high importance scores but are not classified as must-have attributes. Must-have attributes have relatively low importance scores but have large NCA effect scores (i.e., must-have). Low importance attributes have relatively low importance scores and are not classified as must-have attributes.
To calculate the NSAII, the importance scores from KDA (i.e., rescaled weights from RWA) are multiplied by a “relative” effect score from NCA. More specifically, we need both inputs to NSAII to be on the same scale. The importance scores from KDA are already relative in nature with all attributes sharing 100 points. Thus, we need to calculate a relative effect size from NCA effect sizes where the attributes would share 100 points. To accomplish this goal, we sum the effect sizes for all attributes. Then, each attribute’s effect size is divided by this sum. This number is then multiplied by 100 to obtain a relative effect size. Now that both inputs are on the same scale (0 to 100), we then calculate a mean score between these two inputs to determine the NSAII. This provides equal weighting between the two methods. The main benefit of NSAII is that it is one number that combines and summarizes the attribute’s total importance (sufficiency and necessity), with a larger NSAII representing a higher priority for researchers.
Case study
To empirically demonstrate the NSAII, CX survey data for a local coffeehouse was collected and analyzed. The coffeehouse is next to a college campus and its targeted customers are college students. The dependent variable was an index created by combining the Net Promoter question with the best-ever scale and stated improvement scale put forth by Garver (2024). The survey implements 10 product and service attributes that were created and refined by doing qualitative interviews with current customers. After data cleaning, a final convenience sample consisted of 131 respondents.
KDA with RWA
RWA-Web was implemented to conduct KDA with RWA. Given the nature of the data, the RWA Shiny app for multiple regression was selected. The dependent variable index described earlier (Net Promoter question, best-ever scale and stated improvement scale) was selected as the criterion and the 10 product and service attributes were selected as the predictors implementing listwise deletion. The number of bootstrap replications was set to 10,000 with an alpha level of .05.
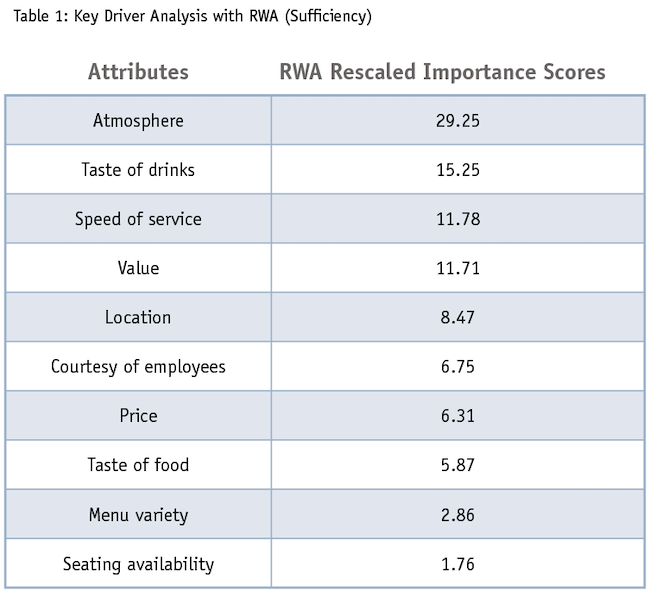
The R2 of this model is .54, suggesting a reasonable amount of variance is explained in the dependent variable. The rescaled weights from RWA will serve as the importance scores, which can be seen in Table 1. For this sample of coffeehouse customers, atmosphere (29.25) is the most important attribute followed the taste of drinks (15.25), speed of service (11.78) and overall value (11.71). These four attributes account for almost 68% of the importance.
NCA results
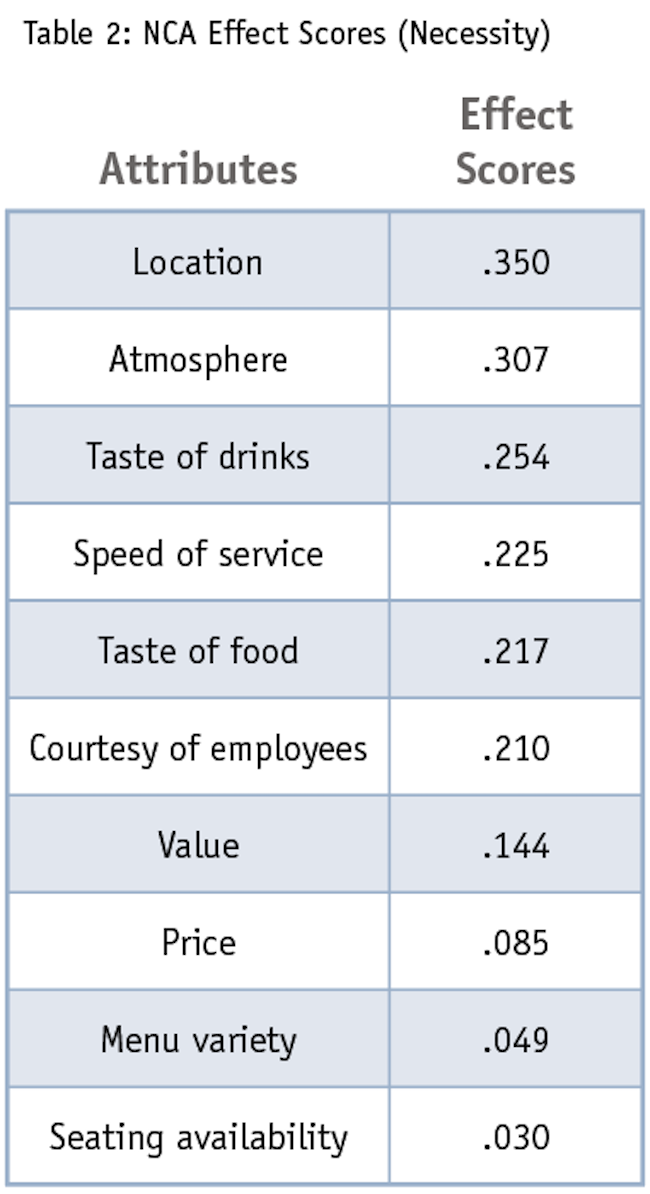
Examining the effect scores from NCA, location (.35) has the largest effect size followed by atmosphere (.307), with both effect sizes being classified as large effect sizes (i.e., must-have attributes). Taste of drinks (.253), speed of service (.225), taste of food (.217) and courtesy of employees (.21) have medium effect sizes. Menu variety and seating available have the smallest effect sizes, which are also statistically insignificant.
NSAII classification matrix
Plotting attributes in the NSAII classification matrix, RWA importance scores are on the vertical axis, while the NCA effect scores are on the horizontal axis. The crossbar for the RWA importance scores is the average importance score, which is 10 in this example (100 divided by the number of attributes). The crossbar for the NCA effect size is .3, which is the guideline for classifying large effect sizes (i.e., must-have).
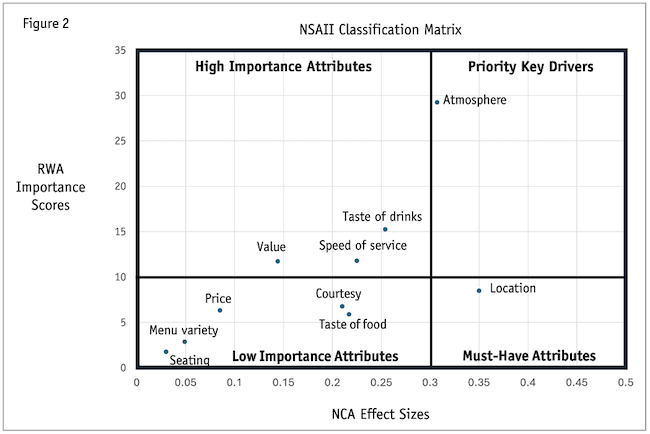
Examining Figure 2, the NSAII classification matrix, atmosphere is a priority key driver because it has a relatively high importance score and a large effect size. Location is a must-have attribute because it has the largest effect size with a relatively lower attribute importance score. Taste of drinks, speed of service and value are high importance attributes because they have relatively higher attribute importance scores with smaller effect sizes. Finally, courtesy of employees, taste of food, seating availability and price are low importance attributes because they have relatively lower importance scores with smaller effect sizes.
NSAII
Table 3 contains all the inputs for NSAII. To calculate NSAII, we first need to calculate a relative effect size where the attributes share 100 points, so that it is on the same scale as RWA-rescaled weights. To accomplish this goal, the NCA effect sizes for all attributes are summed and then each attribute’s effect size is divided by this sum. This number is then multiplied by 100 to obtain a relative effect size. The NSAII is calculated by taking a mean score of the RWA-rescaled weight and NCA relative effect size.
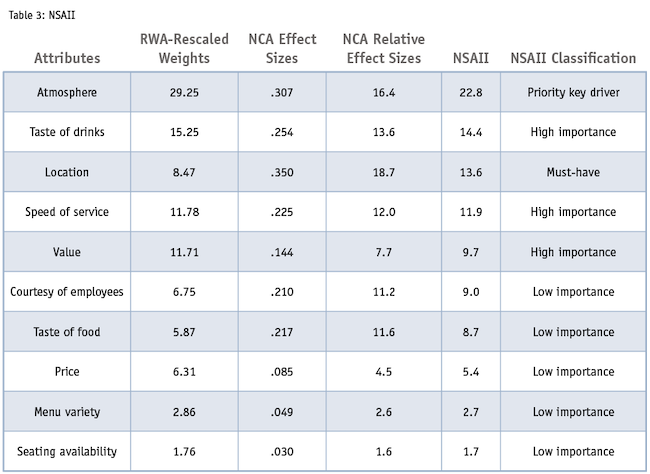
Atmosphere has the largest NSAII (22.8) followed by taste of drinks (14.4), location (13.6) and speed of service (11.9). As a result, these attributes would be prioritized.
The NSAII results share similarities with the KDA results, yet different and more insightful than KDA alone. For example, both NSAII and KDA suggest that atmosphere and taste of drinks are top priorities. NSAII highlights location as a top three priority, which contrasts with KDA alone (fifth priority). Location has lower than average importance from KDA but has the largest effect size from NCA, making it a must-have attribute and third in priority from NSAII. From KDA alone, value has a much higher importance score than courtesy of employees and taste of food, yet these attributes all have similar NSAII scores due to value having a much smaller NCA effect size. These added insights demonstrate the benefit of implementing NSAII as a metric of total attribute importance.
Next steps with importance-performance analysis
Typically, KDA importance scores are used as an input into importance-performance analysis (IPA) to prioritize improvement opportunities. We suggest that market researchers also use NSAII attribute importance scores as an input to IPA. Because NSAII represents both sides of the attribute importance story, we feel it is a more complete representation of total attribute importance and should be incorporated into IPA.
NCA has been proposed as a direct complement to IPA to better prioritize improvement opportunities (Hauff et al., 2024; Garver 2025b). NCA results typically include bottleneck tables, which deliver the level of performance necessary to obtain a desired outcome as well as the percentage of customers who do not meet this level of performance. When NCA is being used with IPA to identify improvement opportunities, critical information from NCA is the percentage of customers who do not meet the necessary condition. If an attribute’s necessary level of performance has already been achieved by a large percentage of customers, then improving this attribute may not be a priority. If an attribute’s necessary level of performance has NOT been achieved by a large percentage of customers, then improving this attribute becomes a top priority. For more information on this process, see the above articles.
Deliver both sides
NSAII combines attribute importance scores from KDA with RWA (sufficiency) with an attribute’s effect size (necessity) from NCA to deliver both sides of the attribute importance story. From this analysis, the NSAII classification matrix will identify four different types of attributes, which include priority key drivers, high importance attributes, must-have attributes and low importance attributes. The main benefit of NSAII is that it is one number that combines and summarizes the attribute’s total importance (sufficiency and necessity), with a larger NSAII representing a higher the priority for researchers.
References
Dul J. (2016). “Necessary condition analysis (NCA): Logic and methodology of ‘necessary but not sufficient’ causality.” Organizational Research Methods, 19(1), 10-52.
Garver M. S. and Williams, Z. (2020) “Utilizing relative weight analysis in customer satisfaction research.” International Journal of Market Research 62(2): 158-175.
Garver, M. S. and Williams, Z. (2024). “Key driver analysis with relative weight analysis: A two-step approach.” International Journal of Market Research, 66(6): 711-728.
Garver M. S. (2024). “Introducing two new scales for more comprehensive CX measurement.” Quirk’s Marketing Research Review (September/October).
Garver, M. S. (2025a). “Necessary condition analysis: New applications for market researchers.” International Journal of Market Research, forthcoming.
Garver, M. S. (2025b). “Using complementary analysis with importance-performance analysis.” International Journal of Market Research, forthcoming.
Hauff, S., Richter, N., Sarstedt, M., and Ringle, C. (2024) “Importance and performance in PLS-SEM and NCA: Introducing the combined importance-performance map analysis (cIPMA).” Journal of Retailing and Consumer Services, 78.