Quieting the loudest voice with data
Editor's note: Joe Urbany is professor, Mendoza College of Business, University of Notre Dame, and co-founder of Vennli Inc., a South Bend, Ind., software firm. He can be reached at urbany@nd.edu.
Markets get commoditized very quickly these days, and competitive advantage is often fleeting and complex to define. But it is possible to analyze and take action on differentiation in a data-driven and visual way to engage the team and streamline decision-making.
Here’s a scenario we’ve seen hundreds of times, using a visual method to take action on competitive strategy and differentiation. The case is hypothetical but based upon patterns observed in many actual cases.
The analysis is generalizable to any context (whether B2B, B2C, nonprofit, product, service, etc.) in which a customer makes a choice among competitive options. Your revenue growth and financial results depend upon bringing the customer’s choice your way.
Struggling to grow sales
Very Good Inc. (VGI) is a successful manufacturing concern selling machined parts used as inputs by other manufacturers. VGI is struggling to grow sales for its XT7 Phenom Controller, an established product that has traditionally been a stalwart for the company but that has recently lost steam.
If we were to ask the Very Good senior leadership team to define how the Phenom provides value to its customers, they would answer with factors like the following: product performs every time; low price; service problems fixed immediately.
Let’s assume the customer segment includes manufacturing leaders like Jim at customer firm Next Step Corp.
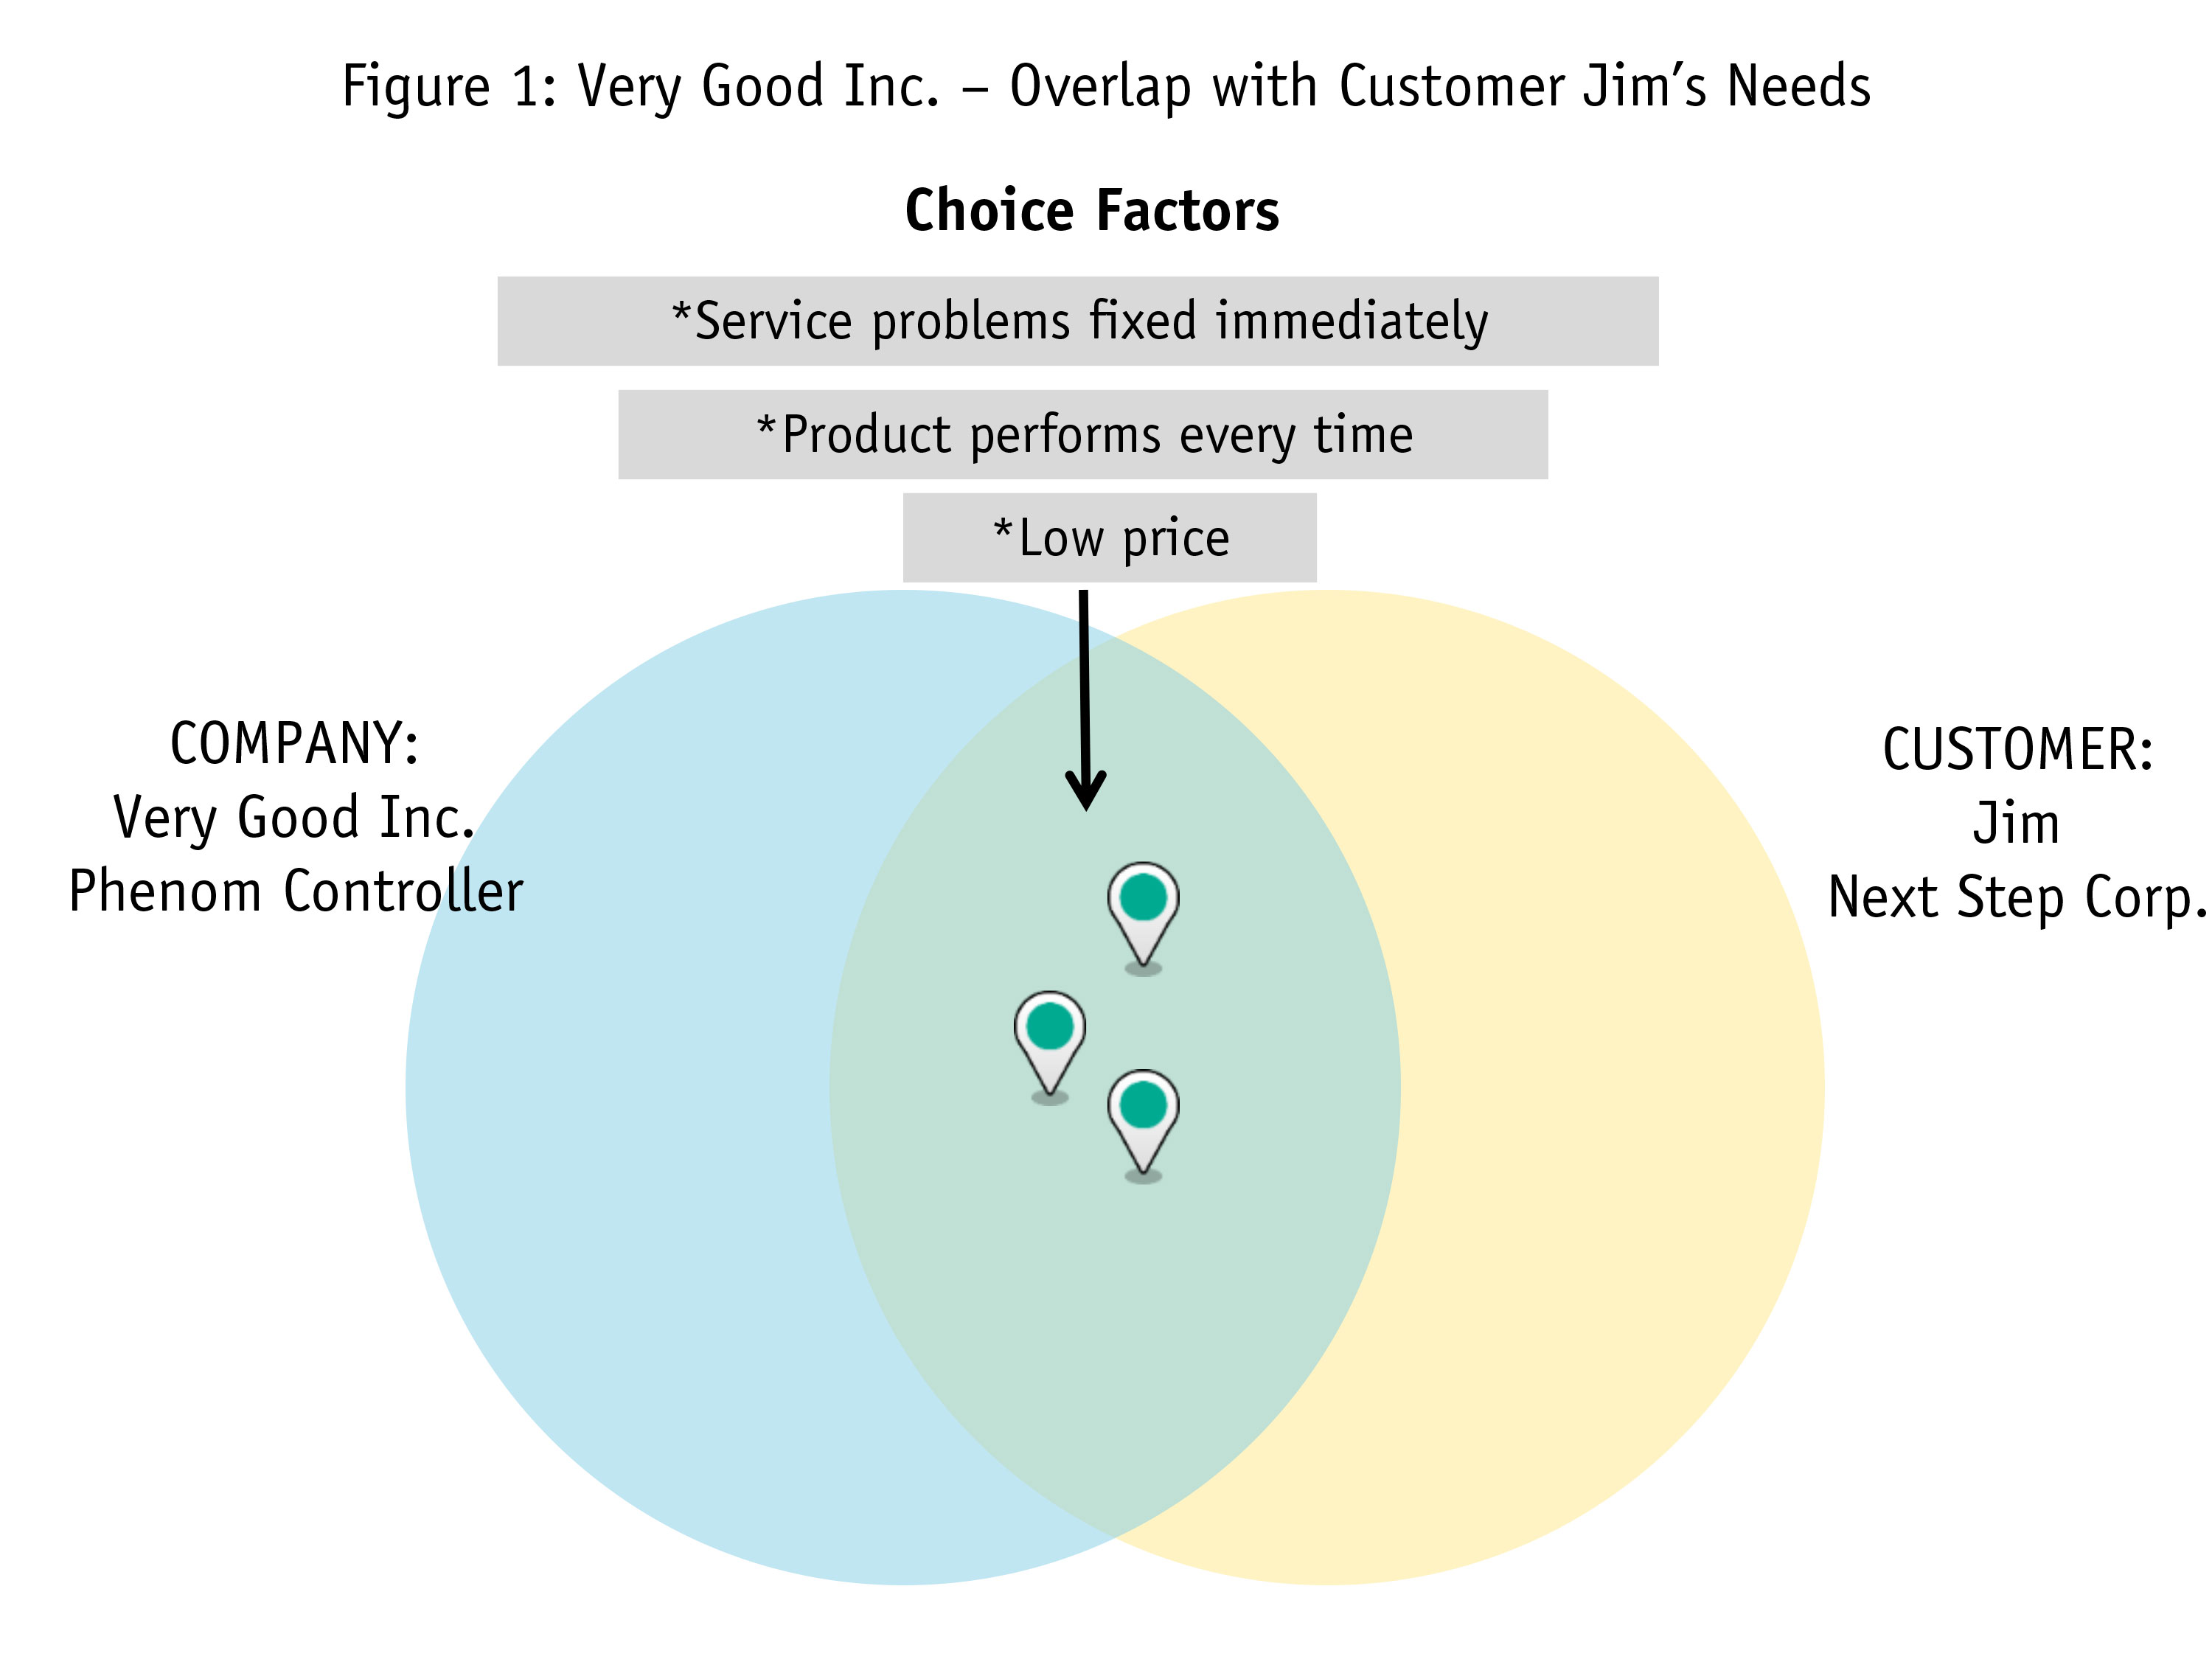
 Figure 1 shows two circles that capture value in the market. The circle on the right represents the set of customer Jim’s needs. The circle on the left captures Jim’s perception of VGI’s offering. Let’s say that the VGI leadership team assumes that Jim is satisfied with the Phenom on the three factors above. As such, those factors – represented as pins in a Google map – reside in the overlap between the two Figure 1 circles.
But it’s important to note that customer Jim doesn’t view VGI in isolation – he chooses between the Phenom and other controller supply options. The fact that Jim chooses is what puts the “competitive” in competitive strategy.
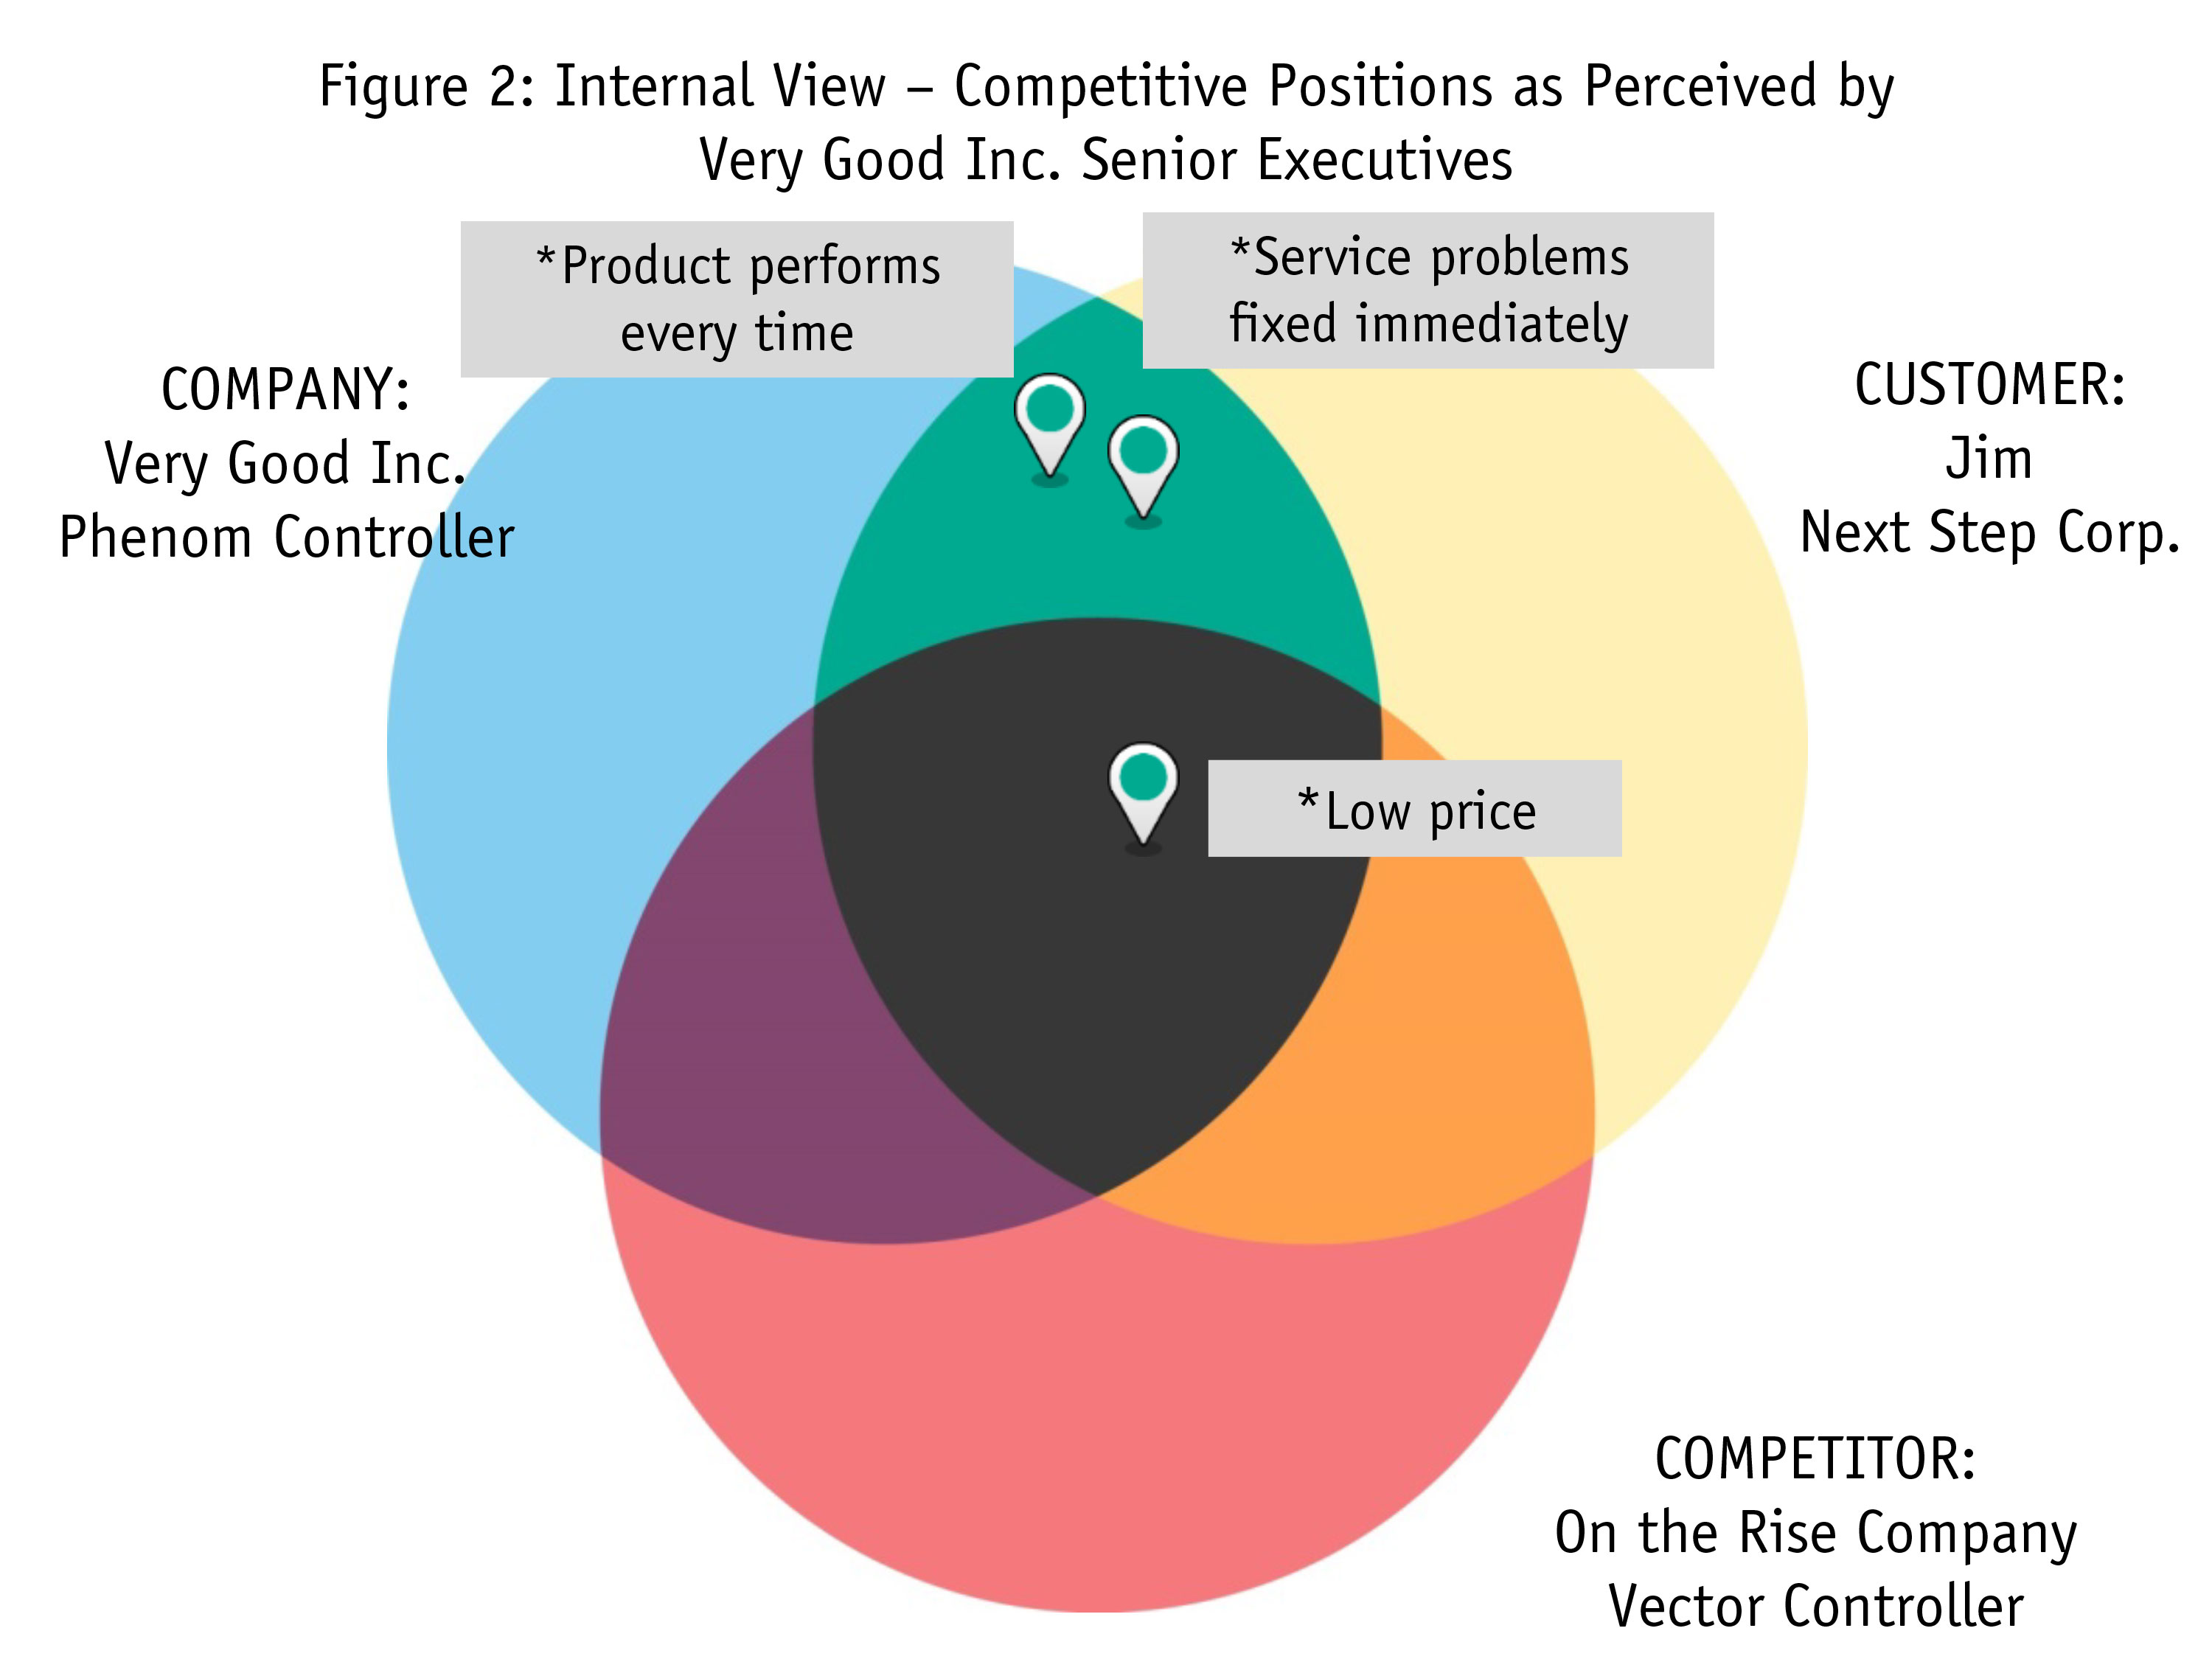 On the Rise Company has an offering called Vector which competes directly with the Phenom. The Very Good executives would admit that “low price” is probably a point of parity between the two rivals but believe that VGI offers distinctive value relative to the rival on the other two factors (Figure 2).
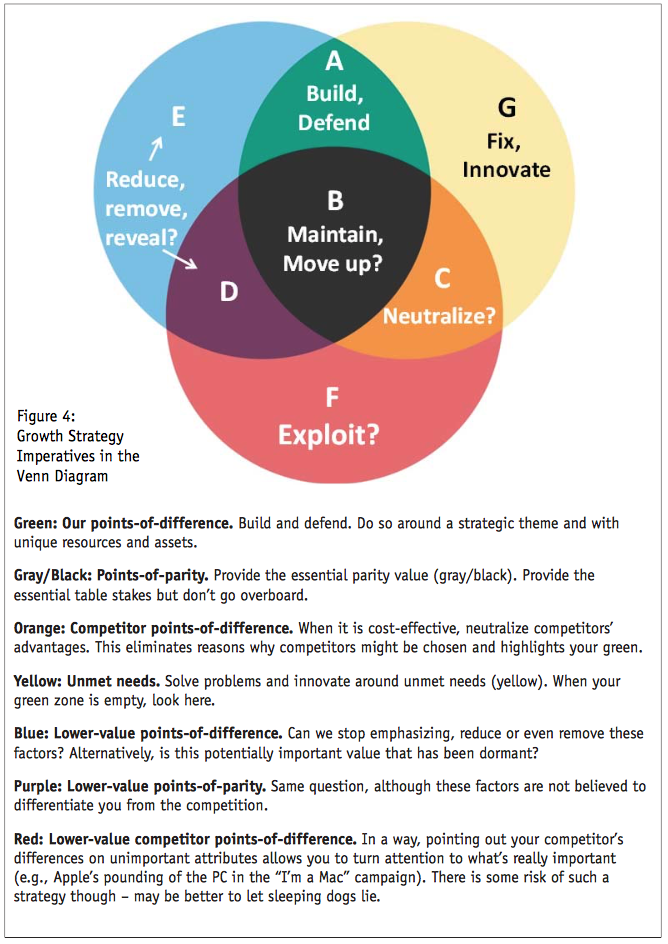
Representing competitive positions via the Venn1 actually reveals other strategically meaningful concepts. Besides identifying points-of-difference for both VGI (green) and its rival (orange), the Venn diagram captures competitive table stakes or points-of-parity in the middle (gray), unmet customer needs (yellow) and lower-value factors owned by either competitor (blue, red) or common to both (purple). Each of these areas of the Venn can play a role in building growth strategy.
Everyone has a theory
When VGI senior leadership meet to generate strategy for improving sales, everyone in the conference room has a theory for moving forward:
Tom, head of sales: “I think we should lower price to gain share.”
Sue, head of finance: “I think we should create a branding campaign around the ‘reliable performance’ benefit.”
Bill, head of marketing: “I think we should promote our service advantage.”
The greater the disagreement, the louder the conversation gets. Everyone knows that the loudest voice in the room ultimately wins the day at Very Good Inc.
What if, however, the team were able to gather data to provide direct insight into customer Jim’s decision-making and to evaluate the different hypotheses above?
They can. Measuring the perceptions and preferences of a sample of Jims is a relatively straightforward matter applying standard, well-established attitude measures. Categorizing the choice factors into the seven Venn categories requires a sorting logic based upon thresholds for a) importance (lower vs. higher), b) competitive differences (different vs. not) and c) brand performance (above or below expectation).
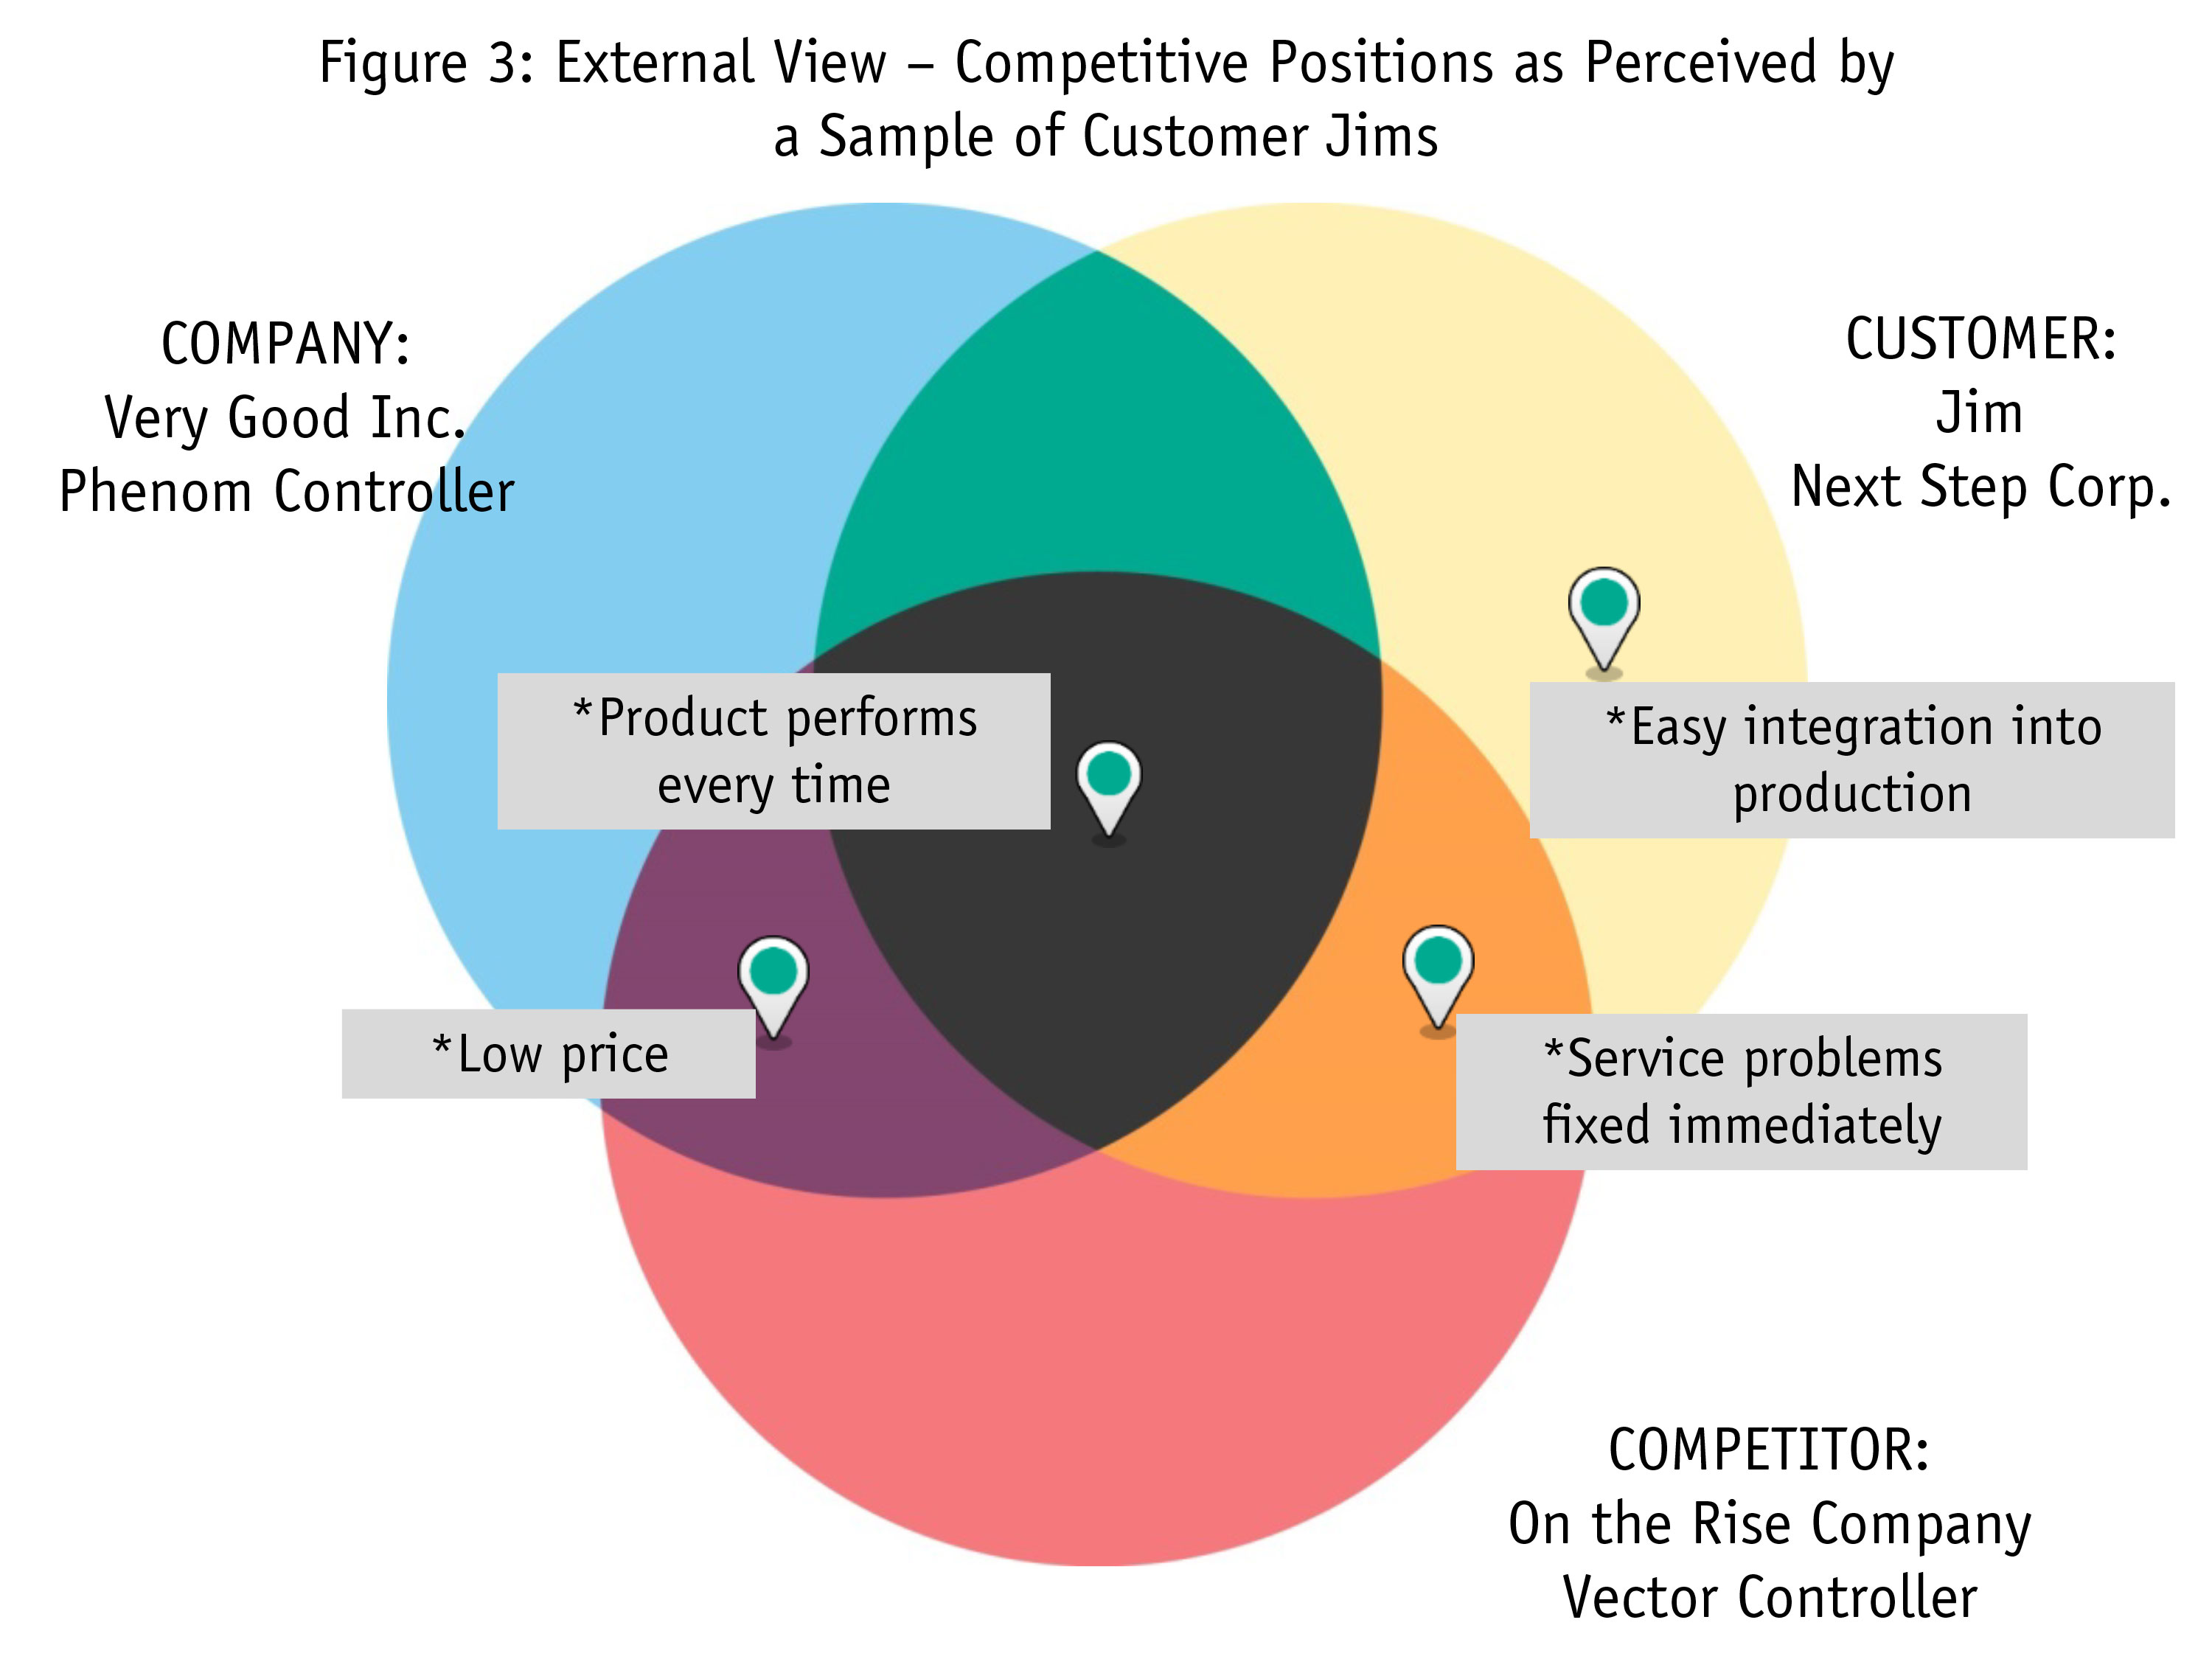
In fact, the results of a survey to measure customer perceptions survey give us Figure 3. These insights from a representative sample of customer Jims show the reality that is actually driving Very Good’s financial performance.
The customers’ actual assessments are very different from the Very Good team’s expectations. While Very Good once might have been the leader on reliable product and fast service, the situation has changed. Customers believe that VGI’s product Phenom is at best at competitive parity on these factors. Worse, the competitor On the Rise is doing something to produce superior service. Price is less important to enough customers that the price pin appears in the purple zone. Seems incredible but this is a common phenomenon, often because customers focus more on nonprice factors in their decisions than you realize.
How is it possible that the team was so far off in predicting customer Jim’s perceptions? Actually, it’s more than just possible. Such gaps in prediction tend to be the norm rather than the exception. Research in psychology and marketing2 has shown consistently that people have a difficult time predicting others’ needs and preferences. This happens because we often project our own needs/beliefs in predicting others’ and seek only confirming evidence of those beliefs.
Shocked they didn’t predict
The Very Good team was in fact shocked that they didn’t predict customer perceptions perfectly – because they regularly talk to customers in sales calls. However, sales interactions may not lend themselves to deep learning about customer needs. Peter Campbell of Nucor Corporation describes it very well: A sales call is often a tennis match in which pleasantries are exchanged, the sales pitch is served up, objections returned and volleys go back and forth to stake out positions. This leaves little opportunity for truly learning customers’ current headaches, challenges and needs.
An additional finding from VGI’s research is the unexpected, unmet need in the yellow zone: customers express a desire for “easy integration into production,” reporting that neither Very Good nor On the Rise delivers effectively. The VGI team was unaware of this concern but it turns out to be very important. The competitor On the Rise knows nothing of this unmet need.
Organized in the Venn categories, the data provide insight beyond traditional studies of attitude or satisfaction. In fact, the Venn categorization allows us to readily evaluate the action proposals from Tom, Sue and Bill:
Should we cut price, as Tom suggests? No way. Prices are at parity and a less important factor for many customers. (Dropping prices would have two downsides: It would raise customer attention to price and away from nonprice benefits, while simultaneously drawing a fast matching response from rival On the Rise.)
Should we follow Sue’s advice to build a branding campaign to promote superiority in “reliable performance?” Sue’s suggestion is questionable until we figure out why customers believe our superiority has gone away. Either it truly has (have we benchmarked On the Rise’s Phenom?) or is this a misperception that needs to be corrected?
How about Bill’s idea of promoting our service advantage? This is a bad idea in the short term. You can’t promote an advantage you don’t have. Instead we’ve got to understand what’s driving customer valuations of service. We can determine whether this is a customer misperception or something radical that On the Rise has done to improve its service.
Move the pins
Instead, take informed action that drives and supports differentiation. In other words, move the pins. Upon seeing these data, the Very Good team reduced the volume of their conversation and began to look at the meaning of the Venn diagram zones and the strategy principles they capture.
All competitive strategy frameworks have differentiation at their core. Think Porter, Blue Ocean Strategy, MacMillan and McGrath, Youngme Moon, Wernerfelt’s resource-based view of the firm, Osterwalder’s business strategy canvas, etc. But at times, the discussion of differentiation underweights the significance of being different from competitors in ways important to customers. What’s missing is a systematic method for identifying differentiation that is truly valuable to customers.
Think Volvo (safety), Amazon (everything you need) and Starbucks (third place; home, work, Starbucks) – competitive advantage requires compelling, unique reasons for customers to choose you. The idea is to stay focused on the green.
When an offering is clearly differentiated, the green zone often holds multiple choice factors that thematically make the organization different in important ways. Most companies, though, are operating in the blind about their current differentiation (or lack thereof).
Build and reinforce differentiation
The key to Venn analysis is the bundling of actions that both build and reinforce differentiation. There are different growth imperatives associated with each area of the model (see Figure 4).
Think of strategy as “moving the pins” to create more compelling value for customers to bring their choices your way.
Sometimes communication is enough to move pins. A global pharma firm used Venn analysis to develop new branding and communications programs designed to move two choice factors (efficacy and managed care) that physicians were perceiving incorrectly. These actions contributed to the brand’s rise from No. 4 to No. 1 in the category.
Similarly, a small specialty recycling firm serving the steel industry was able to change its sales message to neutralize client questions about its long-term stability, a concern it had been completely unaware of. The actions led to an annual sales bump of 10 percent in a recessionary period, competing against behemoth Waste Management.
Most of the time, though, building differentiation requires more than communication. A Midwestern hospital used Venn analysis to identify several unexpected patient insights about its emergency room services and turned around a slide in ER volume with new staffing, training and a 29-minute service guarantee.
The Catholic Archdiocese in a large southern metropolitan area found that prospective donors to a tax credit-based scholarship program were hesitant about state tax credit paperwork, unclear about deadlines and concerned about leadership commitment to this Catholic school scholarship program. Among other actions, redesign of the paperwork process and communications focused on core green-zone differentiators led to a 70 percent increase in donations.
Sometimes discovery of unmet needs (yellow zone) leads to a whole renovation of strategy. The European division of a major global stock exchange shifted millions of funds out of technology development (purple zone) after discovering a need for greater technology flexibility among senior executives at global investment banks in their work with the Venn model. The firm built an “app store” to give the banks access to third-party developers who were coming up with new ideas every day.
Finally, a global technology platform provider recently used Venn analysis in pulling from the market a product based upon insights indicating significant customer uncertainty about differentiation among platforms for lead-management. After validating these insights with other data, the company concluded that the costs of seeking to differentiate this service (both technically and through communications) far exceeded the benefits and dropped the lead-management product (taking a multimillion-dollar charge in one quarter but substantially improving financial results in the next).
Specific actions to be taken
The leadership team from VGI took a couple of simple slides around the organization. One showed the definition of the Venn areas, the other showed the specific actions to be taken (Figure 5).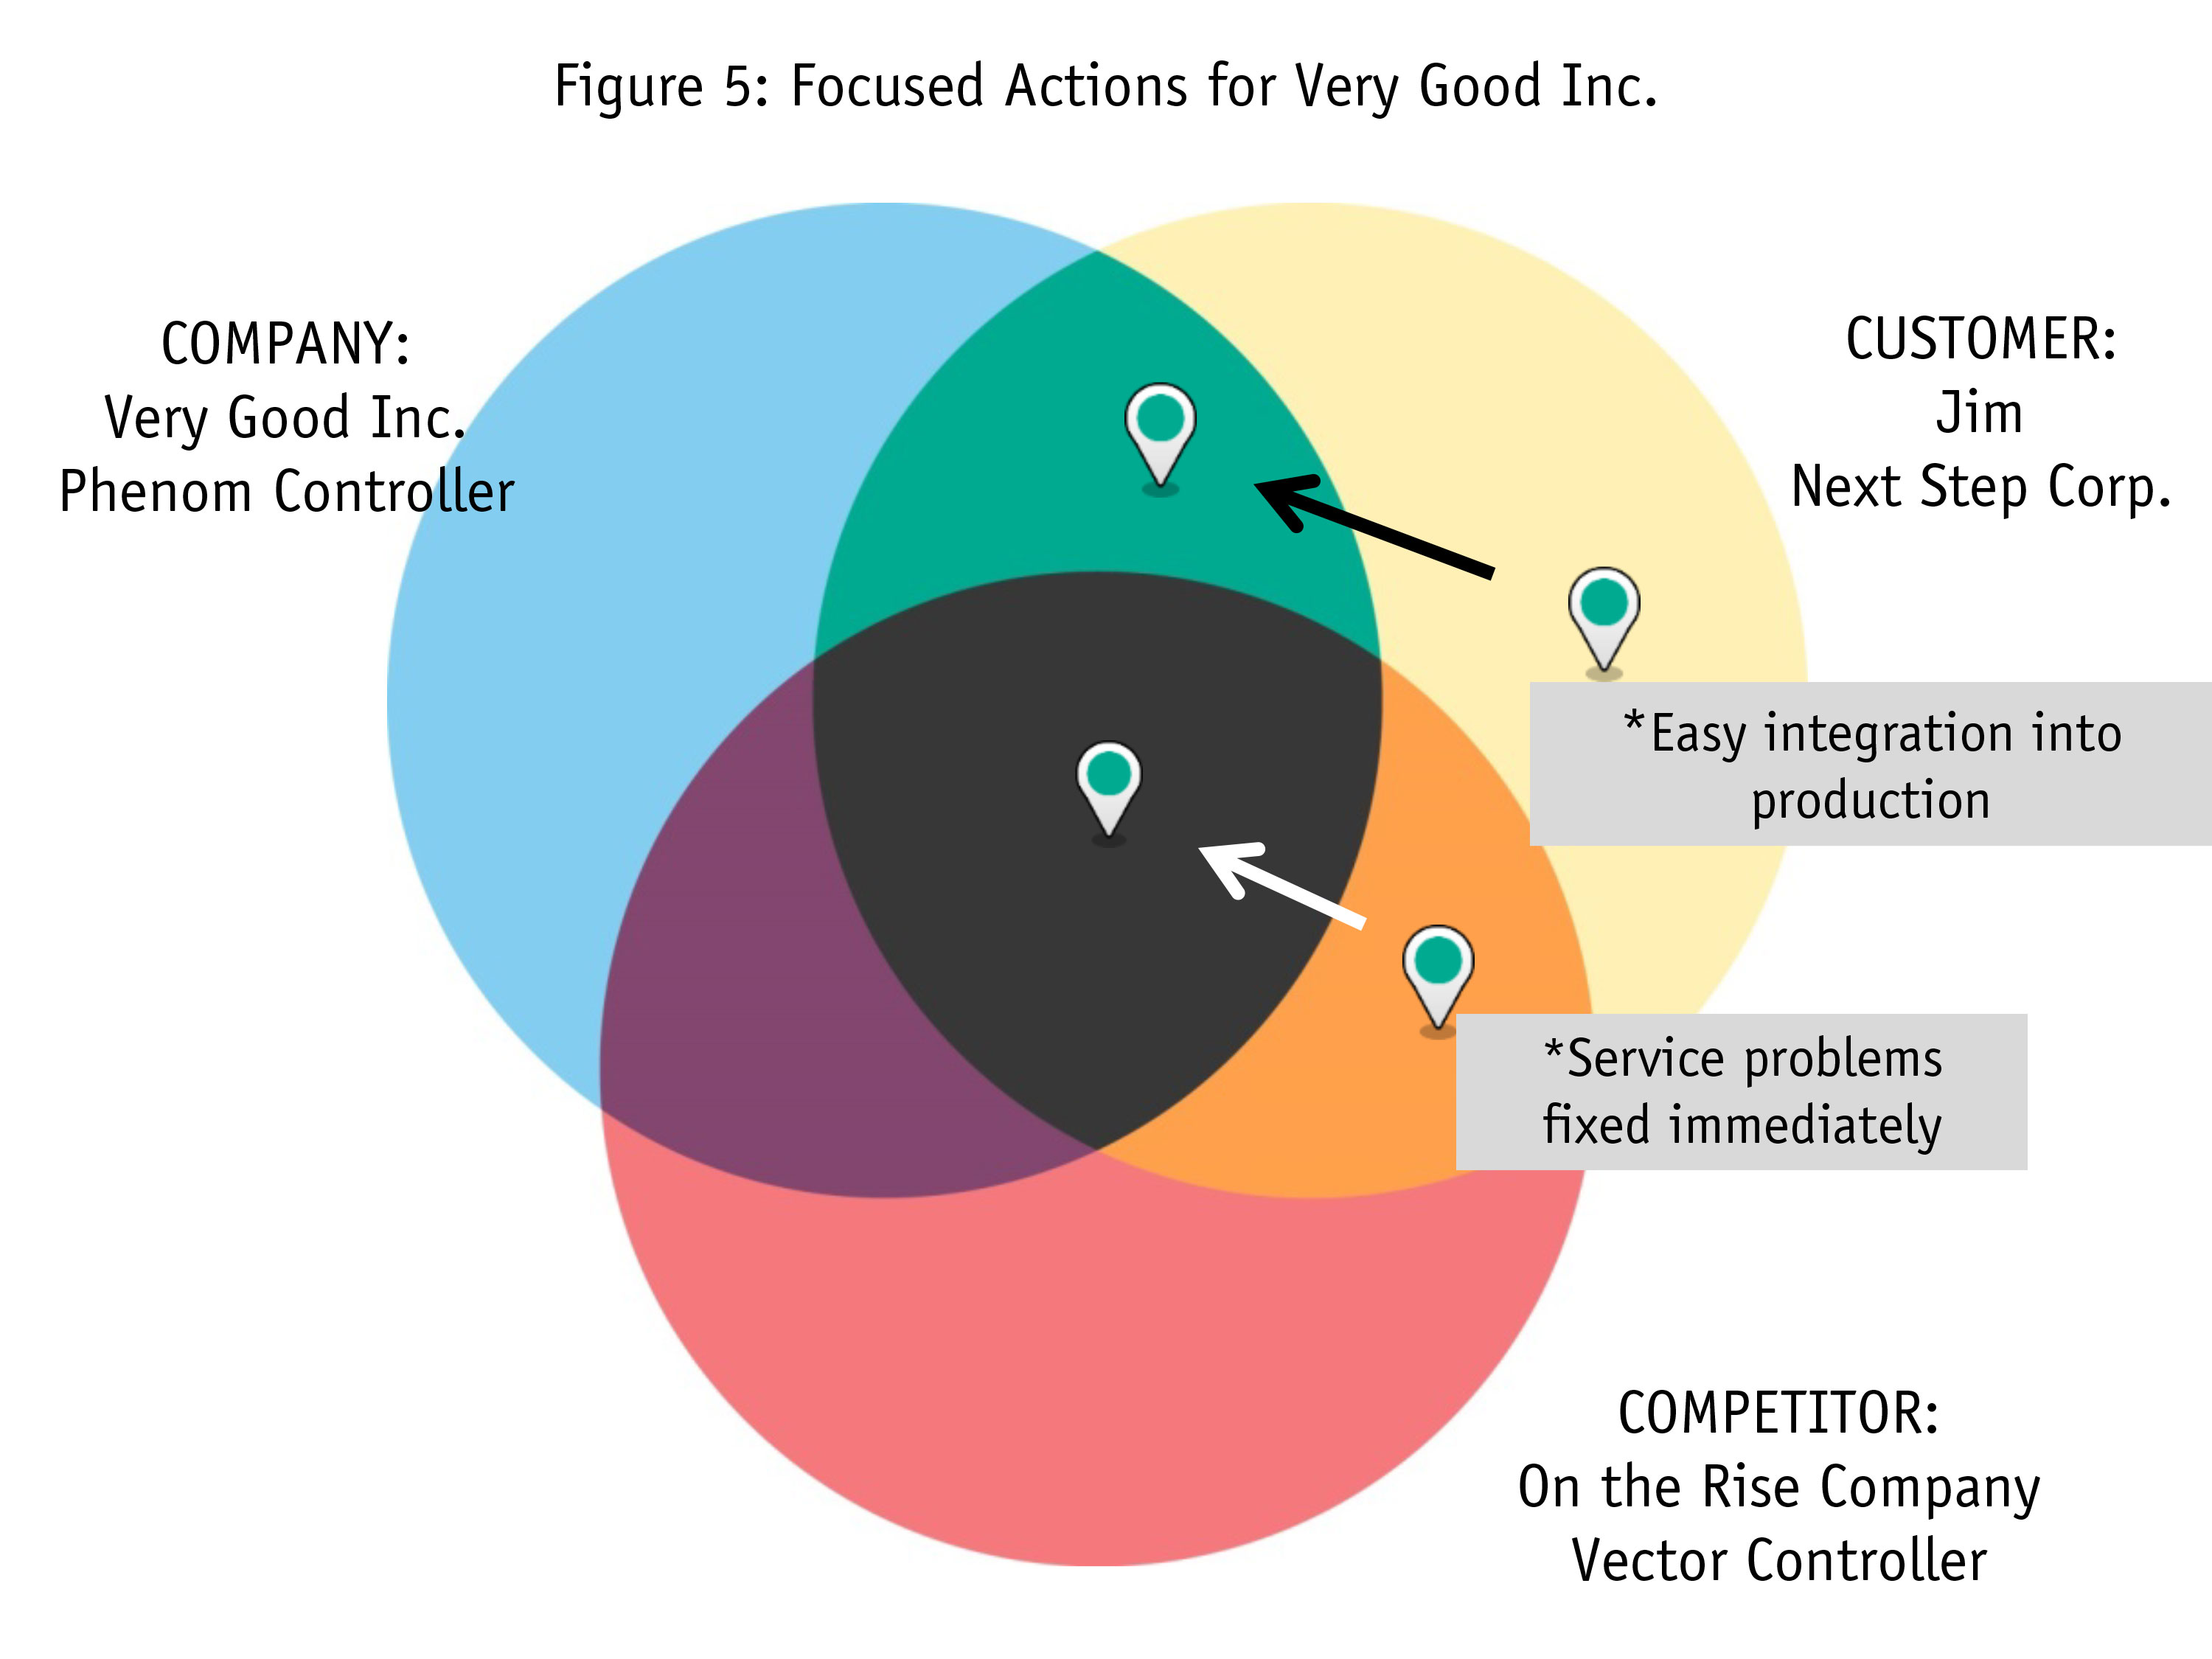
Detailed action plans were developed to focus on two initiatives:
Orange to gray: Eliminate the competitor’s advantage on speed of service response. Effective service processes was a high priority for customers and VGI had lost its long-ago superior position. The VGI team did a detailed review of current service processes, customer insight about why the competitor was preferred and then updated the information system to more carefully track and close service events.
Yellow to green: Staking claim to an important point of difference. When there’s no perceived uniqueness, it’s important to find new points-of-difference. The VGI team did a study to break down their customers’ manufacturing processes to identify how those processes might be made more efficient. They were able to simplify their controller design to allow it to plug more easily into the customer’s process and reduce both time and error. This action has the added benefits of a) providing demonstrable economic value to customer Jim and b) being difficult for the competitor to replicate because it is based upon customer knowledge sourced and owned uniquely by VGI.
Focus time and resources
The value of the analysis above is in helping Very Good Inc. focus its time and resources – something everybody needs today. But it is more than just focusing on the next thing to do. It is the idea of using customer insights to focus on action that will drive the firm’s differentiation and bring customers’ choices its way.
An added benefit is that the visual nature of the framework makes it easy to present to and engage other team members, who understood both the analysis and the goals behind the action initiatives and contribute to buy-in.
It’s possible to push beyond abstract notions of customer-focus and competitive difference for the sake of difference. Combine the two ideas in a measurable way: Build your action plan to ensure you are different from competitors in ways important to customers.
References
1 Urbany, Joel E. and James H. Davis (2010), Grow by Focusing on What Matters: Competitive Strategy in 3 Circles, New York, NY: Business Expert Press. Urbany, Joel E. and James H. Davis (2007), “Strategic insight in 3 circles,” Harvard Business Review (November), Foresight Section.
2 G.A. Gladstein, “Understanding empathy: Integrating counseling, developmental, and social psychology perspectives,” Journal of Counseling Psychology, 30 (1983): 467-482; D. Faro, and Y. Rottenstreich, “Affect, empathy, and regressive mispredictions of others’ preferences under risk.” Management Science, 52 (April 2006): 329-541; D. Kurt and J. Inman, “Mispredicting others’ valuations: Self-other difference in the context of endowment,” Journal of Consumer Research, 40 (December): 73-84; J. Vosgerau, E. Anderson, and W. Ross, Jr., “Can inaccurate perceptions in business-to-business (B2B) relationships be beneficial?” Marketing Science, 27(2008): 205-224. Davis, H. L., Hoch, S. J., Easton Ragsdale, E. K. (1986) “An anchoring and adjustment model of spousal predictions.” Journal of Consumer Research, 13, 25-37.