
Case study: Understanding ad campaign effectiveness
Editor’s note: Kevin Stocker is senior research manager, and Renuka Iyer is director market research, Microsoft.
When COVID-19 hit in the spring of 2020, Microsoft’s Teams usage and perceptions were increasing dramatically due to the pandemic environment. Having observed the astronomical category growth, marketing executives came to Research + Insights to answer this question, “To what extent can we attribute Teams gains to campaign activity vs. market growth?”
As researchers, we would traditionally answer this by relying on time series data, seasonality and other techniques – none of which were at our disposal, especially only being a few months into the Teams campaign and with the newness of COVID-19. In the past, we also reviewed the lift in metrics by recognizers of the campaign compared to non-recognizers, knowing that this was a biased analysis.
Survey research: Recognizers vs. non-recognizers
For years we measured campaign performance through a brand and campaign tracker. This study surveys an external panel of people representative of the general population. At the end of this survey, we showed respondents our current ads and asked, “Do you recognize these ads?” Typically, these ads consisted of a TV commercial, digital ads and/or social ads.
We then cut the survey respondents by recognizers and non-recognizers (those that recognized the ad vs. those that didn’t). We sought to find out if the recognizers had higher overall positive key perceptions than non-recognizers, and if positive perceptions grew faster for recognizers vs. non-recognizers.
Using this method, we would sometimes see that recognizers scored over 20 points higher in key perceptions than non-recognizers. Generally, we took this as a good sign. But we knew that there were several factors that would potentially introduce bias:
- Almost always, our campaign target audience is more technologically savvy, making them more likely to notice advertisements from tech companies.
- They may be users of the category (i.e., Teams, Zoom and Slack users).
- They may already like and/or use Microsoft products (i.e., Windows users, M365 users, Bing users, etc.).
- They may have higher perceptions, either for Microsoft generally or for the specific product.
This made it harder to prove if respondents recognized the ad because of their potential bias, or if they had higher perceptions because they saw the ad.
To add to all this, recognizers and non-recognizers are at their core, different audiences. Non-recognizers tend to be simply more “leaned-out.” They are not really into tech, they are likely not looking to purchase as soon, they may be older and so on. This then begs the question, “How do we suss out true campaign impact?”
Marketing research case study: Ad campaign effectiveness
Research methodology
Weighting it out
For the Teams campaign, we asked our research agency to try weighting. The research vendor did some modeling to figure out which variables most attributed to recognition, and then weighed the populations against those variables to smooth out the differences.
Equalizing propensity
While we were happy with the weighting results, we wanted to evolve the methodology to scale across any campaign measurement. We partnered with our research agency in developing an innovative process called propensity score analysis (PSA). It looked like this:
- Model the tracker data set to identify variables that drive recognition.
- Using these variables, assign every respondent a score that determines their probability to recognize a campaign.
- Take those people in the recognizers and non-recognizers groups and match up the probabilities.
During this process, we lose a decent amount of the sample as the non-matches are discarded, but we now have a dataset of the same probability of recognition from both groups. This is essential to controlling bias for those people that already like and use our products. It also smooths out all those tech-forward attributes, allowing for much more believable results.
When we saw lifts in perceptions, such as “Teams helps me feel better connected,” we could confidently attribute that specifically to the campaign because we knew our dataset was comparable in terms of demographics and technology attitudes – plus, intuitively the campaign was designed to move those things.
Results: Understanding Microsoft’s Teams category growth
The first challenge we faced was, “Is this category growing solely due to COVID?” We saw Teams usage and recognition grow as the pandemic continued. The second challenge resided in smoothing out the differences between the recognizers and the non-recognizers. So, we needed to control for the category and control for the audience (Figure 1).
Figure 1
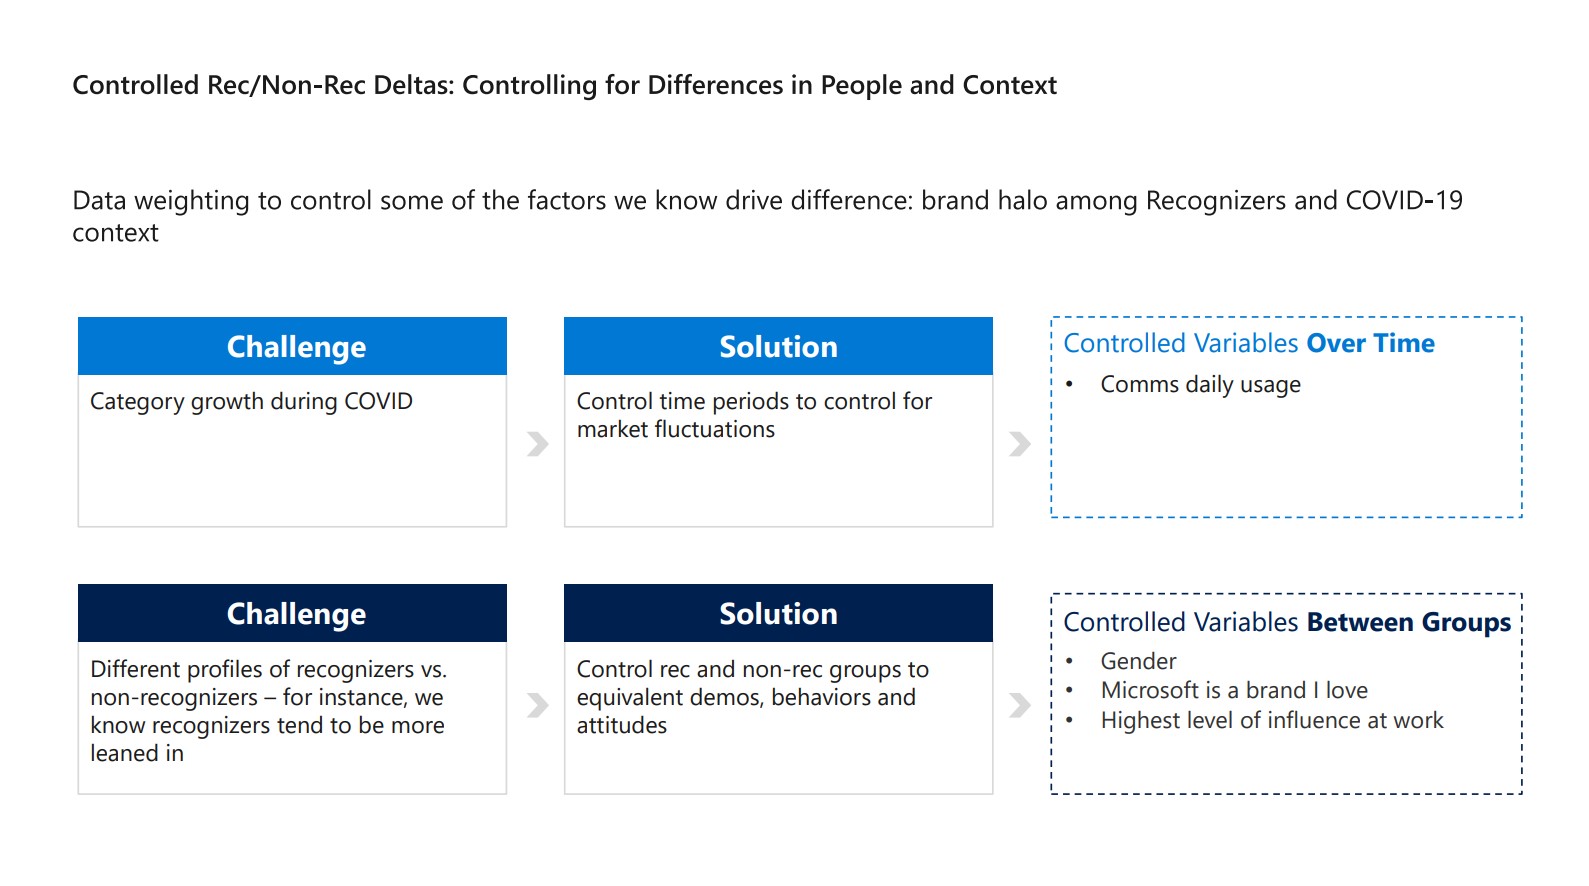
Teams “usage intent” was a key change to control for to account for category growth, and through modeling there were other variables identified as key in causing differences in recognizer and non-recognizer populations, such as “awareness” and “familiarity”.
Figure 2 shows what this looked like without controlling for the bias through PSA looked like this.
Figure 2 - Not controlling variables: Audience and category
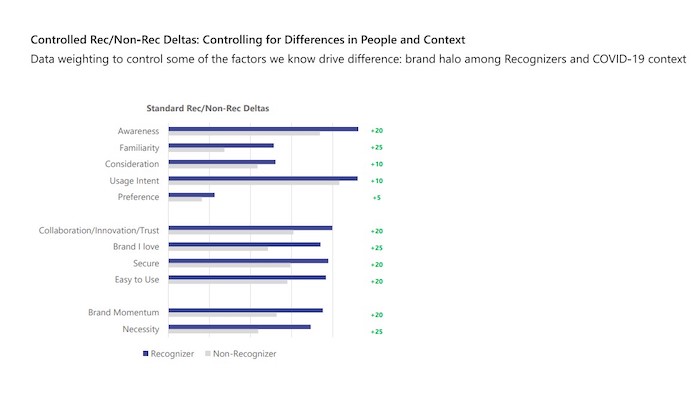
In Figure 2, you see incredibly large deltas between recognizers vs. non-recognizers. We could have used these numbers to pat ourselves on the back, but in reality, we would be falsely attributing the campaign for these high scores. Then, when we matched our recognizers to non-recognizers on their probability to recognize using PSA (Figure 3).
Figure 3
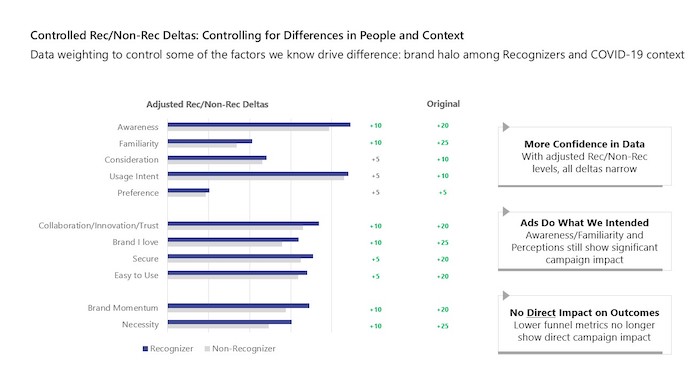
The first column in Figure 3 is the adjusted delta after the control. You still see a significant lift, especially for awareness and familiarity, but not as dramatic as say 20+ points. This gives us more confidence that the data represents reality and concludes the ad was doing what it intended to do. In the Teams campaign, “familiarity” was the goal, because Teams was a young product that had not yet been advertised on a broad scale.
We can now answer the question confidently we were tasked to solve – yes, the campaign had a direct effect because even after we controlled and reduced the gap, we still saw a significant delta. We can also confirm the campaign helped us in other areas which were not a direct goal, such as “brand momentum” and “necessity.”
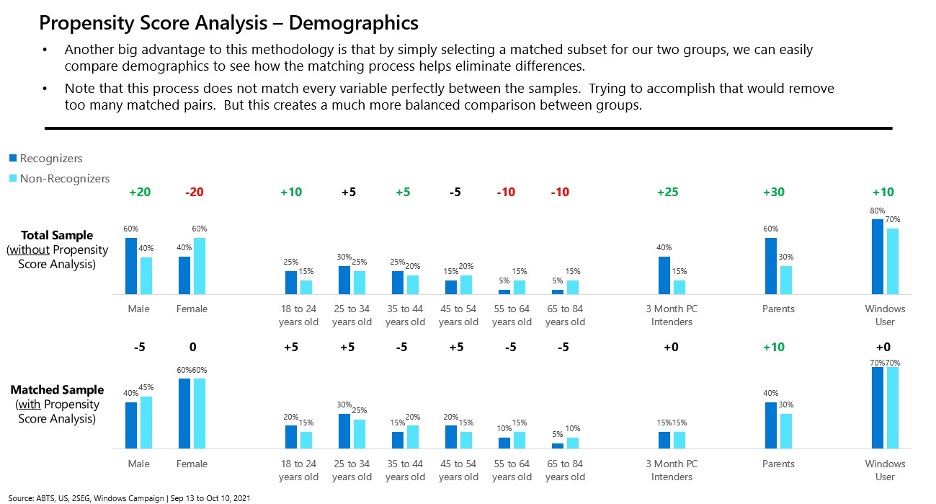
The other key stats that gave us added confidence in campaign impact were that key demographics and stated behaviors were also comparable between the two groups (Figure 4).
Figure 4
The outcome: Understanding campaign impact with propensity score analysis methodology
Going forward, the PSA methodology gives us a clearer view of actual campaign impact in the comparison of recognizers vs. non-recognizers.
The PSA methodology provides confidence that what we are looking at is truly due to a campaign effect, thus helping to direct marketing decisions to optimize for that effectiveness.
We still need other signals, but this methodology helps to eliminate variables where we can contribute the point difference to the campaign. In research, especially when analyzing or comparing two groups, there is always a likelihood of audience bias. In this case, we divided our population into recognizers vs. non-recognizers, but we can see a world in which we are doing something similar by dividing people into two camps, and regardless of what those are, we can minimize the bias by doing this kind of analysis. The PSA methodology helps to minimize the audience effect and get to the core answer to the question, “Are we seeing an impact on whatever action we are taking?”