Editor's note: Steven Struhl is principal at SMS Research Analysis, Philadelphia.
Last month, in the first part of this two-part series on the remarkable realm of Bayes nets, we covered some background, including what Bayes nets do and what makes a Bayes net Bayesian. We touched on some of the ground rules and then discussed the central concept of conditional probability. We also showed how conditional probability can solve problems that really elude us intuitively, including the famous (or infamous) Monty Hall Let’s Make a Deal problem, in which you decide whether to stick with the door you chose or switch to another one.
This month, to wrap things up, we'll show what makes them so notable, giving two practical examples dealing with the type of messy data we often find at the end of a research study.
Patterns and connections
As mentioned in the first article, Bayes nets find patterns and connections in data. They seek out the best connections among sets of variables, showing which variables are most closely related and how all the variables in a data set work together to predict the dependent variable.
In this example, we will show how one network found a compelling structure in a very messy data set. This was a typical sprawling questionnaire, where everybody involved had a pet question or two (or four) and then of course expected their questions to appear in the final model. The more thoughtful people of course knew that all these questions were not needed – some items even could be spotted right away as near duplicates – but this did not alter the strong general expectation that everything would get fit into the model.
This type of data set often leads to considerable frustration for the person charged with making some sense of it all. This is especially the case if developing a true multivariate model becomes an objective only after those involved say collectively, “There is too much to make any sense of here!” following many brave struggles with stacks of devotedly-prepared crosstabulations.
There are only a few options for dealing with such unruly data sets and making a model with all or most of the variables. Both structural equation models (SEMs) and partial least squares (PLS) path models have been turned toward this use. However, both of these methods struggle with a large burden of variables to process.
PLS path models require a great deal of testing and retesting, grouping variables and moving variables from group to group. Finally, with a large number of variables, none of the predictors seems to have much effect. SEMs share many of these complications and also may fail to run at all. As these models grow large, they also need to include fleets of “unknown” quantities, typically not shown in any final discussion but essential for the model to run. The large number of items and connections can be difficult to juggle.
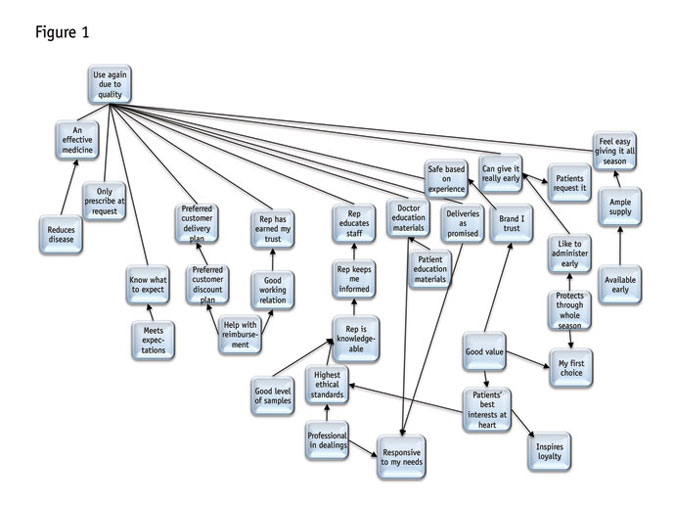
However, as we will now explore, Bayes nets do nearly all the hard work themselves. In this example from a study of a pharmaceutical product, the entire network was monstrous, with 54 variables connected to the dependent measure (“I would use this again due to quality” on a likelihood scale), including: an effective medicine; product reduces disease; I know what to expect; preferred customer delivery plan; inspires loyalty; brand I trust; ample supply; good level of samples; my first choice; rep keeps me informed, etc.
The diagram in Figure 1 shows how the network found logical arrangements in these variables. The complexity here can be daunting. Yet when we look carefully, one section at a time, there are many surprising yet intuitive relationships. For instance, starting in the lower right, note how “inspires loyalty” comes from the idea that the company “has patients’ best interests at heart” and that “good value” in turn supports “patients’ best interests.” Good value also leads to “my first choice” and “brand I trust.” “Protects through the whole season” is another factor going toward “my first choice.”

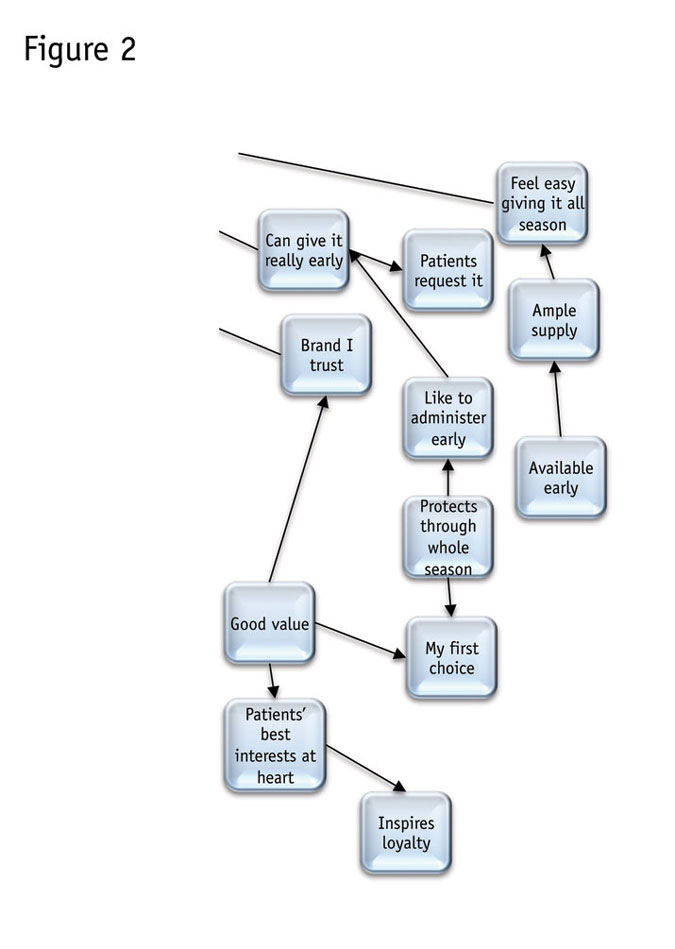
Let’s pull aside just the variables closely related to “my first choice” (Figure 2). Note that its closest connections are “good value” and “protects through the whole season.” These both seem to be more hard-edged, objective criteria. But then, good value is linked directly to “(has the) patients’ best interests at heart.” So a drug is not really a good value unless the doctor believes the maker cares about patients.
Also back in the larger diagram, note all the variables that are not directly connected with “first choice,” including the more relationship-oriented “responsive to my needs.” That is its own focal point, in fact (at the bottom somewhat to the right of center), where (rather neatly), “professional in dealings” and “deliveries as promised” converge with “doctor education materials.” For some pharmaceuticals, such as vaccines, it is key to doctors that they get the right materials that explain the applications and even storage of the product.
Throughout the network there are other very logical-seeming connections. Anywhere we look, the chains of variables and how they connect, makes sense. Note that not all the arrows go toward the dependent. But recall that variables will have effects on the dependent or target variable, regardless of which way the arrows point.
The fit is very good, with 63 percent correct prediction of the target variable – very strong considering we used a stringent “hold out” testing method called cross-folded validation. We can discuss cross-folding at another time but it means that the correct prediction level has been reached with stiff testing requirements.
Did not have to struggle
Importantly, we did not have to struggle trying to fit together this model ourselves, as we would have needed to do with the SEM and PLS path-modeling methods. We did have to give the model all of 20 seconds to run and do all its validation testing. Certainly there was advance time spent making sure the data set was clean and ready to analyze. But beyond that, we just needed to follow a few relatively straightforward steps:
- testing several alternative network-building methods and seeing what they produced;
- finding if adjusting the threshold for “value of information” affected results;
- checking to see if further restrictions on the number of connections between parent and child nodes improved structure;
- testing a few connections to see if they could be reversed to clarify relationships; and
- trimming a few connections that were extraneous (there are a few characteristic forms of connections within networks that, based on experience, can be safely eliminated).
At each step we checked overall network performance based on two criteria. The first, correct classification levels, will be familiar to those having experience with discriminant analysis. That is, we determine how well each value of the dependent variable is predicted. The dependent variable in this example could take 10 values. We also tested information scores, not accepting a solution where the information score was appreciably worse than the best we obtained.
However, paramount was whether the network made substantive sense. Did the connections not only predict the dependent variable but also convey a coherent story about the data? Here we have both a coherent story and very strong overall predictive power.
Other questions follow
Understanding patterns in variables is valuable but then other questions follow, most importantly: What are the relative effects of the variables on the dependent variable and how strongly does changing each variable affect the dependent?
Figure 3 shows an example where, thankfully, the predictor variables were heavily weeded. This is based on an information technology product and a very long questionnaire. The network is represented more simply to fit on the page. Correct prediction levels were very strong indeed for fitting questionnaire questions to behavior. This model was 74 percent correct with the same stringent validation of results.
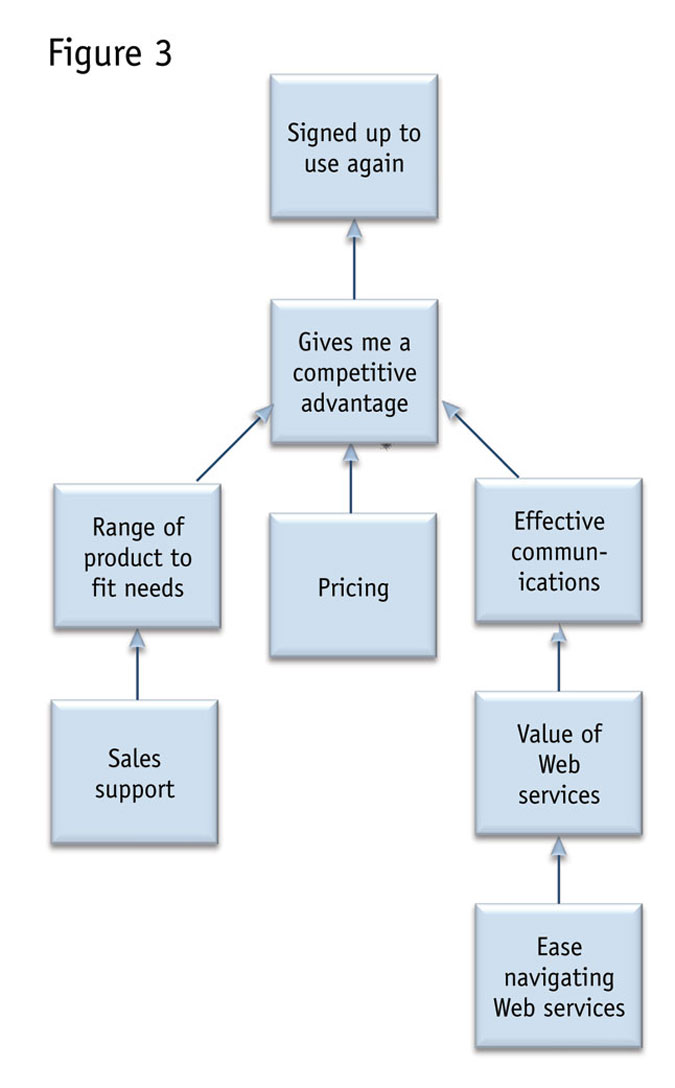
Those of us who have tried using questionnaire questions to predict actual behavior know that this almost invariably has poor results when using regression-based models. While networks do not always do as well as this one, they typically have outperformed regression-based models on overall measures of model fit with a behavioral target variable, such as actual use levels, buying the item in question and so on.
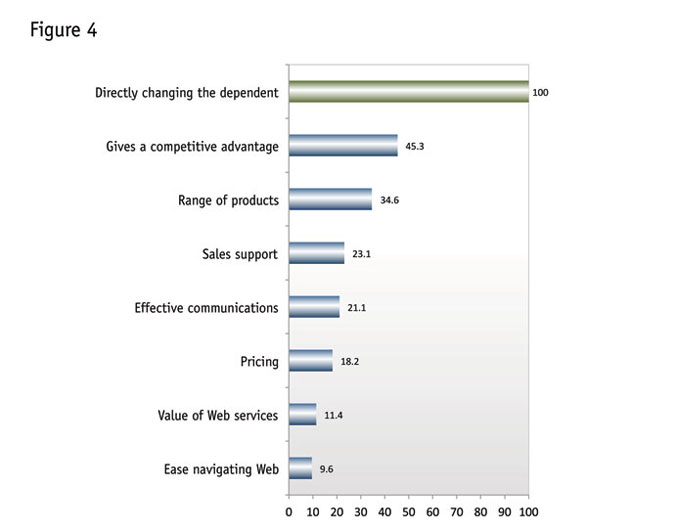
Recall that the network also determines the importances of the variables and sensitivity of the dependent variable to changes in the independents. Next is perhaps the best variable-importance-measurement chart that your author has seen (Figure 4). It compares the effects of changing each variable to directly changing the dependent variable. The chart shows that, for instance, changing “gives me a competitive advantage” has about 45 percent of the effect of directly changing the dependent.
Beyond this, we have actual sensitivity of the dependent variable to changes in the independents. Following (Figure 5), we can see the range of expected effects associated with these importance scores. Here again it is really important to restate that this model does not show causation. So we cannot say, for instance, that changing the score on “gives a competitive advantage” to 10 will increase signing up again by 12 percent (going from 76 percent to 88 percent).
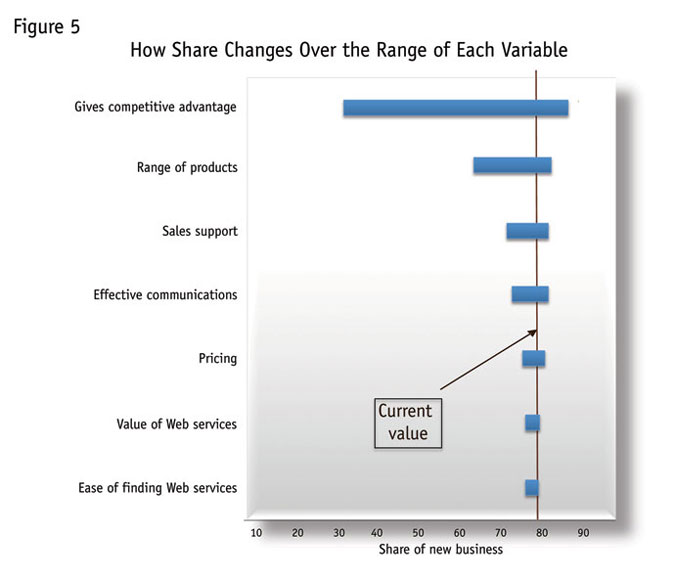
We can say that if signing up ever reached 88 percent, then we would expect an average of 10 out of 10 points on this measure. Neither event seems that likely!
We also can see that there is considerable downside risk to letting these scores slip. That is, very low scores on this measure are consistent with a very low rate of signing up again.
Most areas have considerable downside risk. This would be expected where baseline scores in each area are high and so could fall very sharply. We do notice that “gives a competitive advantage" and “effective communications” are the only areas that have much of an upside – that is, where gains would be associated with considerably higher shares. All the other areas are close to saturation – the point at which higher scores give minuscule incremental benefit – or actually may have reached it, as in the Web-related scores at the bottom.
Reaching back to concepts discussed in the first installment, what makes these estimates so powerful is that all parts of the network are linked and so effects in changing one variable take into account all the other variables in the network. We do not need to assume, as we do with regression-based models, that when we change one variable all other variables remain constant. That kind of assumption is very workable when we have a controlled experiment, as we do with conjoint analysis or discrete-choice modeling, but it is not realistic when we are dealing with data gathered by questions and observations, as in a questionnaire.
That is, Bayes nets move beyond a salient limitation in analytical approaches to date when finding the effects of variables. Assuming we reach a network configuration that makes sense, we see the most realistic estimates of how variables influence each other.
What we cannot see here, unfortunately, is that the network diagram itself reflects how all variables change when we change any one of them. When we manipulate any variable, the target variable and all other variables in the network change. The network diagram shows this in real time.
Confusing world of choices
Software can pose problems. Programs present a confusing world of choices. Applications range from free to incredibly expensive and from remarkably capable to nearly useless. Not all the free programs are of the “nearly useless” type and your author is not yet sure that all the really expensive ones are “remarkably capable,” although we would believe so, since several have been selling at very lofty prices for years. (Not all programs offer even limited trial versions but many do, so you can try before you buy.)
Most programs can solve logic problems. That is, you can build networks in them by hand, as we did earlier, and use those networks to answer specific questions. However, there are many programs with salient limitations. For instance: only some allow editing of networks made elsewhere; only some can find structures in data; only some allow for multiple methods of searching for structure; and only some give strengths of relationships.
Some do not even accept data files. They are just for solving logic problems.
There are lists of Bayes net programs you can refer to and explore. KDnuggets has one such list (www.kdnuggets.com/software/bayesian.html) and it seems to have a good number of programs. Kevin Murphy at University of British Columbia also has a list: http://tinyurl.com/7nn5mo.
From your author’s perspective, to make full use of Bayes nets, you need a program that allows you to do the following: screen variables; find structures in data; see the network diagram and edit it as needed; incorporate expert judgment with results from data; do what-if analyses; and summarize the effects of variables on a target or dependent variable.
Some packages will do even more, such as:
- deal with “censored” data (data that is deliberately omitted, as in questions that are skipped in questionnaires);
- cluster variables based on similarities;
- create latent variables from clusters;
- cluster respondents based on clustered variables;
- find optimal policy;
- evaluate alternatives in terms of costs;
- include constraints on variables;
- include temporal (time sequence) relationships; and
- include nodes representing equations and many other non-data-driven factors.
Admittedly, doing everything listed with one package will land you squarely at the more expensive end of the price continuum. And so far, no program has approached the “ideal” spot where costs are low and capabilities manifold and robust. Again, a number of programs offer trial versions that at least give some sense of what they can do. If cost is an issue, with careful searching, you should be able to combine two or more lower-priced options to meet your needs.
Manifestly worth it
Overall, even if there is some need for exploration, the results are manifestly worth it. These are incredibly powerful methods and their capabilities are being expanded constantly. It may take a little time to master them but Bayes nets look very much like the next wave in data analysis, truly the “best newest thing.” They are eminently well worth getting to know and putting to use.