Editor's note: Keith Phillips is senior methodologist with SSI, Shelton, Conn.
How do we, as researchers, decide on quality data? We usually look at the behavior of participants within a questionnaire itself. We look at how long they took to complete the survey, what they wrote in the open-ended questions, whether they gave the same answer option through a grid question, if they gave consistent answers and we look at quality-control questions. These quality-control questions are designed to measure attentiveness and remove participants who are not paying attention.
There are different types of quality-control questions. Some are simply inserted within a grid and ask participants to select a specific punch; others measure quality by allowing participants to contradict themselves. Some intentionally misdirect participants, so that the question being asked is in the detail of a long instruction and the question is not at all what it seems to be.
Quality-control questions assume that participant misbehavior in a particular moment is indicative of misbehavior throughout the entire survey. For this reason, the data quality is improved with the omission of this participant. An alternate assumption is that a degree of inattentiveness is normal throughout a survey and participants may be attentive during the trap question but not during key measures. Conversely, those failing the trap may not have been paying attention in the moment but are contributing elsewhere, meaning many are no different than the participants that are being kept.
First hypothesis
Working at a sample provider, I see many questionnaires for a variety of industries conducting an array of research. One thing I have noticed is the variety of quality-control measurements used to validate the online self-completion surveys; in particular, the varying amount of participants being excluded due to poor data quality, which was specifically dependent on the quality-control questions.
This led to my first hypothesis: Design of the quality-control question has a large impact on the number of participants flagged for having poor data quality and it is more a measurement of question effectiveness than participant quality.
Knowing that these quality-control questions threw out such a wide range of participants, I formulated a second hypothesis: Exclusion based on quality-control measurements would result in a variety of sample compositions and some of these would be more accurate than others.
The test
In order to test my theories, I designed an online survey that looked at 15 different quality-control measurements: 12 quality-control questions, speeding, straightlining and an open-end assessment. The survey was administered among 2,100 online participants in the U.S. The survey covered a mixture of topics including entertainment, social issues, lifestyle and general behavior questions. The survey used 12 offline benchmarks as measurements of quality to compare the data against. The median survey time was 12.5 minutes; short enough not to encourage fatigue.
The results
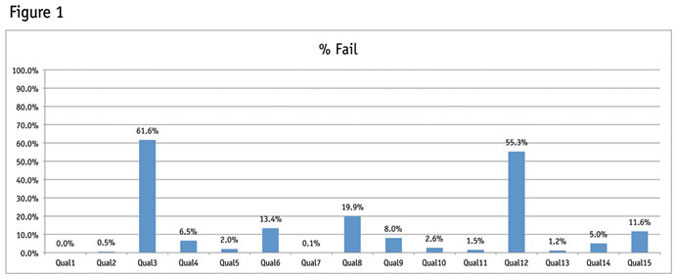
As illustrated in Figure 1, my first hypothesis proved true: the design of the question itself has a large impact on the amount of participants being excluded from the sample. Shown here is the percent of the same sample that failed each of the quality-control measurements. There is a large distribution that goes from 0 percent failing at Qual1 to 61.6 percent failing at Qual 3. More detail on each of these quality-control measurements will be given later in this article.

Each quality-control measure was developed with the intention of measuring the amount of poor data quality in the data set. Yet, each measure produces a different quantity of poorly-behaving participants and therefore is not capturing the badly-behaving individuals who are corrupting an entire data set. Instead, it is measuring the ability of the participant to do the right thing in the exact moment, which is completely dependent on the task at hand and not on an inherent inability of the participant to provide quality data.
Although my first hypothesis proved to be true (the design of the quality-control questions greatly impacts who is flagged as having poor data quality), my second hypothesis did not prove true. Although each of these quality-control questions did remove a different group of individuals it does not appear that it improved the overall data set against offline benchmarks. In fact, the data stayed flat regardless of how I removed participants.
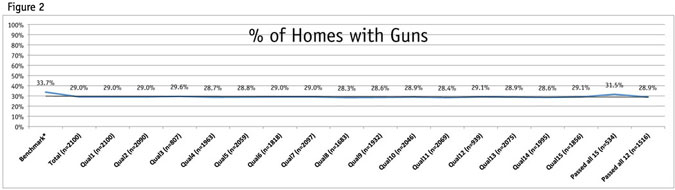
Figure 2 illustrates the percentage of households that own a gun. The results of our study remain the same (between 28.3 percent to 31.5 percent) regardless of which quality control measure we use to exclude participants. It may appear as though the second-to-last segment, which is made of participants who passed all 15 quality-control measurements, displays a slight uptick towards the benchmark, but the Figure 2 shows that the quality is not necessarily better within this segment. (Benchmark taken from the 2012 General Social Survey from NORC.)
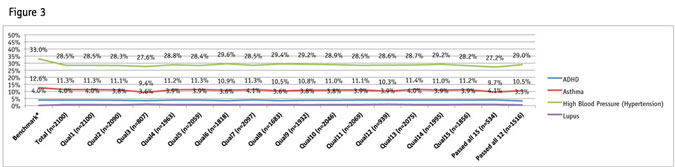
The chart in Figure 3 shows offline benchmark data for illnesses. This graph indicates that the group of participants that passed all 15 quality-control measurements actually moves away from the benchmark. However, no statistical significance can be found regardless of which quality-control measurement is chosen. (Data for the benchmarks is based on information taken on the American Heart Association, Lupus Foundation of America and Anxiety and Depression Association of America Web sites, along with the 2011 National Health Interview Survey. In some instances estimated figures were provided and the percentage was created against census adult population figures. These are just estimates for a point of comparison within this research.)
So why is the data so consistent regardless of which quality-control measurement is used for exclusion?
- Some of the quality-control measurements exclude too few to impact the sample.
- The quality-control measurements that exclude a large proportion of participants appear to do so at random.
Knowing that each quality-control measurement removed a different group of participants and yet achieved a similar result compared to the offline benchmarks, I decided to segment the data by varying levels of poor behavior. When creating the segments used in Figure 4 I excluded the three quality-control questions that were misdirection/traps, as these removed such a large proportion of individuals, I did not feel like they were an accurate barometer. I will evaluate these types of quality-control measurements later in this article.
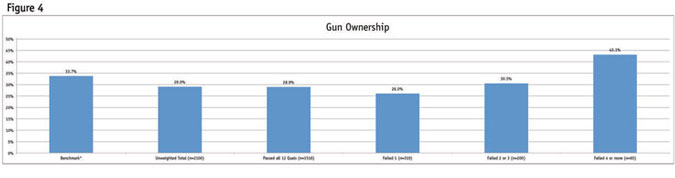
Figure 4 shows that those failing four or more quality-control measurements out of 12 are statistically different than the overall sample. (Benchmark taken from the 2012 General Social Survey from NORC.) Although at 65 this segment of culprits is small, it is an important consideration to remove them from the data set, as they could over-index within a particular segment during analysis.
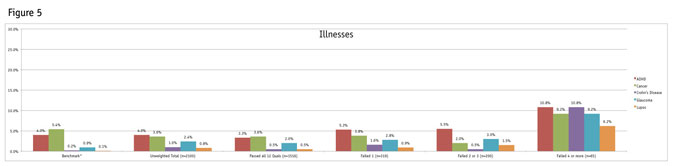
The variation across segments is even more pronounced among the illnesses. Although a majority of the participants within the segment failing four or more quality-control measurements did not select these illnesses, there is a statistically significant increase in the volume of selections among this group as illustrated in Figure 5. (Data for the benchmarks is based on information taken on the American Cancer Society, the Lupus Foundation of America, Living with Crohn’s Disease, the Glaucoma Research Foundation and Anxiety and Depression Association of America Web sites. In some instances estimated figures were provided and the percentage was created against census adult population figures. These are just estimates for a point of comparison within this research.)
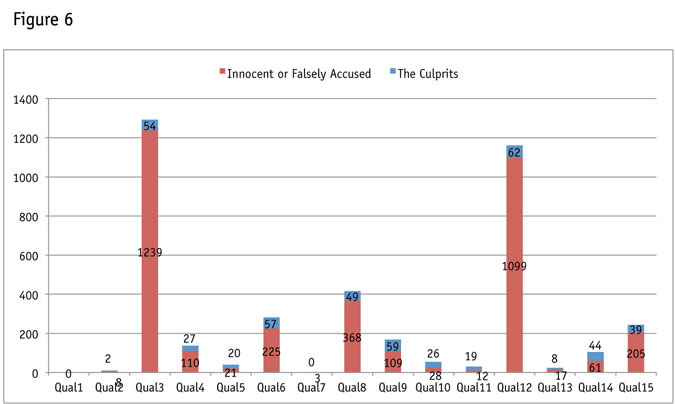
With an established criteria for the culprits (those actually behaving poorly in the survey by failing four or more out of 12 quality-control measures), I went back and reevaluated each quality measurement to see what proportion of the 65 culprits they captured as well as how many of the innocent or falsely accused (participants that were not found to be culprits) they throw out of the data set (Figure 6).
An evaluation of quality control measures
In this next section, I evaluate each of the quality-control measurements based on the definition of the culprits created from my segmentation.
Traps/misdirects (Qual 3, Qual 8 and Qual 12)
Appropriately named, these questions seek to identify inattentive individuals. The problem is they are poorly designed for survey research and many people who have good data quality throughout the remainder of the survey end up failing them. They assume a greater level of attentiveness than most people are willing or able to give, in the context of a market research survey. A questionnaire writer’s main goal is to design a questionnaire that answers the questions posed by the client while at the same time reducing the risk of bias by making the questions as easy as possible to answer. These types of traps do not do that.
See the Quality 3 question below, which is failed by 61.6 percent of participants:
One aspect of this study is to understand how people process the questions that are being asked to them. This information is useful when doing analysis. There are many aspects of a person’s behavior that are related to the way they answer questions. One aspect is their ability to stay engaged throughout a survey and a person’s willingness to read the directions fully. To make sure you are currently engaged, we would like you to answer “None of the above” to the question below.
Which of the following adjectives would you use to describe yourself?
[Randomize] Depressing Boring
Intelligent Interesting Plain
Caring Fun Adventurous
Passionate Fashionable Generous
Honest Thoughtful None of the above
Inquisitive Anxious [Anchor]
Most people will see this as a question about adjectives they would use to describe themselves. They believe they do not need to read the full instruction in order to answer the question. However, the full instruction commands the participant to select “None of the above.” The participant has to read the instruction fully and have the sense to follow the instruction rather than to answer the actual question (which comes after the instruction).
Qual 8 used the content of a section as a misdirect question. The section is about amusement parks. During the section, midway through a question, the topic changed. An instruction was presented to select a specific punch (19.8 percent of participants failed). Because previous questions in the section were similarly worded about different amusement parks, it is no wonder some participants would answer the question before reading it fully.
Qual 12 failed 55.3 percent of participants and was the last quality-control measurement of the survey. This misdirect presented a short paragraph and at the end, participants were instructed not to answer the question below but to select the next button and continue answering questions on the next page. Then an easy question was presented and answered by 55.3 percent of individuals, all of whom are considered as poor-quality respondents for doing so.
These types of trap/misdirect questions have no place in evaluating data quality.
Conflicting answers (Qual 1, Qual 7, Qual 10 and Qual 13)
There were four types of conflicting-answers questions given during the questionnaire. These types of questions are usually masked, as they were in this survey. These questions did not do a great job of capturing all of the culprits because they generally flagged too few people.
Qual 1 asked dog owners how many dogs they owned. Only dog owners got the follow-up question and only those answering 0 to the follow-up were flagged. No one in this study was flagged based on this question.
Qual 7 only flagged three people, all of whom were falsely accused according to the criteria defined above. This measurement looked at participants who said they had not been to a movie in the theater in the past 12 months but then flagged them if they mentioned they went to the theater this past weekend in a later question. In between the questions there were several movie titles presented so it’s easy to see how someone could have changed their mind.
Qual 10 was the most effective at capturing culprits but really this was more of a straightline/grid check. Within a short grid, participants were presented with both of the following attributes “I love to go shopping at the mall” and “I hate shopping at the mall.” If participants selected “agree completely” or “disagree completely” for both they were flagged for poor data quality.
Qual 13 was an age validation from the age given at the beginning of the questionnaire, with the one collected at the end. It flagged 17 falsely accused while flagging eight culprits. Perhaps annoyance, inattentiveness or error would cause someone to put in the wrong age.
Out of 2,100 participants, these are small numbers.
Fake names check (Qual 4)
Inserting fake brands into an awareness question is not a new technique and has the downside that someone selecting a fake brand is not necessarily satisficing through the survey. Perhaps they believe they know the name or perhaps they feel they should know it. In my survey I inserted foreign names of made-up individuals in an awareness question for famous actors. The names Edward Bersalote, Emelie Suganob and Lorraine Gusinalem flagged 110 falsely-accused, while only capturing 27 of our 65 culprits.
Open-end check (Qual 5)
For this check I used the three open-ended questions asked to everyone. I looked for participants who did not contribute to any of the three open-ends (those putting in nonsensical answers or simply typing in random text). This check only flagged 21 of the 2,035 falsely-accused, while also flagging 20 of the 65 culprits.
Speeders (Qual 14)
Surveys can take a varying amount of time to complete. For this reason, it is better to look at the standard deviation when considering a speeding definition. Each survey path must be evaluated, especially if these paths have varying lengths. It is not fair to hold participants to the same length standard, if one received 30 questions and another received 50. This questionnaire was roughly the same length for all participants. At first, I looked below two standard deviations from the mean after removing a couple of the longest outliers (those outliers appear to have paused during the survey). That definition only left us with one participant. For this reason, we used a “bottom 5 percent” rule for speeders, specifically for this test, but this is not something we would recommend for all survey types. This check identified 61 falsely-accused, while grabbing 44 of the 65 culprits.
Selecting low-incidence items (Qual 2 and Qual 11)
Qual 2 asked participants to check which illnesses among a list of 11 they have been diagnosed with by a doctor. Those checking off three or more illnesses among the eight illnesses that had an incidence of 5 percent were flagged for potentially poor data quality. This quality-control measurement was not effective. The question was the ninth in the survey and the check flagged only eight falsely-accused and two culprits.
Qual 11 was the most efficient at removing culprits relative to the amount of falsely accused but was not thorough enough to remove all the culprits. The general thought process is that culprits will be rushing through the survey without fully reading the question or answering honestly. This check identifies someone as behaving poorly, because they are checking off too many items to be realistic. However, an argument is easy to make that some culprits do not check off enough items to begin with and simply answer the question as quickly as possible.
Qual 11 presented participants with a list of eight activities and asked if they had done any in the past weekend. The most likely item on the list (watch TV) was ignored. Anyone saying they have visited the remote location of Alaska was flagged for potential poor data quality. Anyone who selected three or more of the remaining six items was flagged for poor data quality. This check flagged 19 culprits, while flagging only 12 falsely-accused.
Qual 11
Which of the following have you done over the past weekend? Please select all that apply.
Flew in a helicopter Watched TV
Visited McGrath, Alaska Went skiing Played poker
Visited a flea market Went geocaching
Went bungee jumping None of the above
Grid checks (Qual 6 and Qual 9)
Grid checks – asking someone to select a specific item within a grid – vary in efficiency. If I were to ask a participant to select a 6 on a scale from 1 to 10, then I would expect everyone to select 6. If I were to do this in a 100-item grid, then I would expect a higher proportion of participants to not be reading the attribute, due to the fatigue that was inspired by the design of the question itself.
Furthermore, if a participant can answer multiple items in a grid without reading through the attributes, then they may be inclined to do that. For instance, I asked participants to evaluate how interested they are in seeing each movie in the theater among a list of 18 films (Qual 6) with a five-point definite interest scale. If a person does not like going to the movie theater and knew they did not want to see any of the films in the theater, what would prevent them from answering “definitely not interested” to each answer option without thoroughly reading through them? And if they did, are they doing anything wrong, based on the design of the question and what is being asked?
This is why position of the quality-control attribute (the attribute that tells the participant to select a specific punch) is important within the grid. If it comes as the first attribute fewer participants will fail it, but once the process of filling in the grid is established, a higher proportion of participants will fail the quality-control attribute. Research from my colleague Pete Cape found that within a grid, the average item response speed is under 500 milliseconds, which is hardly time to fully process the implications of the item being presented. If the desire is for participants to take their time when answering questions, why put them into a grid, which encourages just the opposite?
I asked a movie grid check (Qual 6) as the 15th question in the survey. It was failed by 13.4 percent of the sample. It flagged 225 falsely-accused and 57 culprits for not selecting “definitely not interested” when instructed to do so.
Qual 9 was the 26th question asked in the survey. It used a 10-point likelihood scale to evaluate six activities and instructed participants to select the number six among these. Qual 9 failed 109 falsely-accused (half as many as the movie grid) but failed 59 of the culprits (making it just as impactful as the movie grid).
Keeping grid questions short results in a more accurate quality-control measurement. This check can be useful but it also needs to be in the context of a question that forces participants to read each attribute. I do not recommend the grid check, because it is not masked from the participant (a small percentage will not follow it intentionally to see what will happen) and unless it appears as the first attribute in the grid, it will capture a higher proportion of innocent individuals than culprits.
The solution
A researcher’s desire should be to remove all the culprits from the data set, while trying to remove as few of the falsely-accused as possible. None of the quality-control measurements removed all of the culprits but almost all of the quality-control measurements removed some of the falsely accused.
The solution is to use multiple quality-control measurements that are efficient and remove participants who fail one or more of these measurements. In my study, I used: Quality 11 (low-incidence items done in the past week/travel to remote location); Quality 5 (the open-end check); Quality 10 (conflicting answers in a short grid); Quality 14 (speeders check); and Quality 9 the grid check (told to check 6 within a short grid).
If I flagged every participant who failed one of these questions, then I would have failed 195 falsely-accused and have captured all 65 culprits. By removing people who fail only two out of the ideal five, I am only flagging 35 falsely accused and capturing 60 of the 65 culprits.
One limitation of this test is that I intentionally tested a wide variety of quality-control questions for evaluation purposes. Because the actual solution is to use more than one, it stands to reason that different variations of the most efficient quality-control measurements could be used throughout a survey experience to evaluate data quality.
In summary, researchers should not be using badly designed quality-control questions, which hurt feasibility and create a poor user experience. Misdirects or true traps fall into the category of quality-control questions that researchers should not use. To further this point, this article illustrates that quality-control measurements that throw out a large number of participants do so at random and do not improve data quality. Researchers should also keep in mind that any survey participant can become disengaged in the moment and fail a single quality-control question. Removing these participants does not improve data quality. For this reason, participants flagged for removal should have failed multiple quality-control measurements.