An application of eye-tracking to shopper insights
Editor's note: Brian A. Espin is a graduate student in the consumer-industrial research program at Cleveland State University, Cleveland, Ohio. Colin M. Valdiserri is co-founder and CEO of Informed Decisions Group Inc., a Cleveland research firm.
Now more than ever, marketers must focus their attention on in-store marketing and brand visibility. A 2012 study conducted by Point of Purchase Advertising International (POPAI) found that 76 percent of all purchase decisions are made in-store – a significant increase from the organization’s 1995 study, which placed this figure at 70 percent. The study also found that visual cues, such as product packaging, displays and point-of-purchase marketing materials, are among the most important factors in the shopper decision-making process. Traditionally studied using shopper recall, these visibility factors are now being examined by many marketers through eye-tracking technology, which provides an objective assessment of where shoppers are placing their visual attention.
Eye-tracking research has proven to be of great value to marketers. It has allowed them to gauge the visual attention given to their products and displays and has aided in improving their visual marketing efforts. But two of their most common questions have remained unanswered: 1) What is the impact on sales of the visual attention given their brand(s)? and 2) Does directly measuring visual attention provide any information above and beyond that of shopper recall? To investigate these questions, we first reviewed the relevant academic literature.
Visual attention and purchase decisions. Studies have looked at whether visual attention impacts product consideration and preference. Pieters and Warlop (1999) used eye-movement data to investigate whether brand preference could be determined by visual attention. They had participants choose among six brands presented in a display. The results revealed that chosen brands were fixated-on significantly longer than non-chosen brands. Similarly, Chandon, Hutchinson and Young (2002) used eye-tracking to study a decision-path model of visual attention and brand consideration. In the study, participants looked at pictures of supermarket shelves containing two product categories (orange juice and laundry detergent) and were asked which brands they would consider purchasing. The results showed a strong relationship between purchase consideration and visual attention.
Visual attention and recall. In a study on shelf positioning and facings, Chandon et al. (2009) looked at the potential use of recall as a proxy for visual attention. The researchers had participants look at images of supermarket shelves containing soap and pain relievers and later asked them to recall which brands they remembered seeing. Recall was found to have a weak correlation with attention but was strongly correlated with consideration. According to the authors, “This shows that recall is biased toward preferred brands and provides additional evidence that it may not be a good proxy for visual attention.”
Logical next step
Given the academic findings on how eye-tracking is linked to purchase behavior and recall, testing these results using real-world mobile eye-tracking and purchase data was our logical next step. To accomplish this, we used data collected from an eye-tracking study carried out by Cleveland research firm Informed Decisions Group Inc. The overarching purpose of this research was to provide a framework for answering these commonly asked questions.
The research was executed at one retailer across 12 different locations in the U.S. The 146 participants were pre-recruited using a third-party facility to ensure they were regular shoppers of this retailer. Upon arrival to the retailer, participants were instructed to shop and buy what they normally would for that day. When participants were finished shopping, they were then asked to complete a brief follow-up survey about their shopping experience. The questions used for the analysis in this article include recall of products seen while shopping and recording the items purchased. For confidentiality reasons, brand names have been anonymized as Brand A through Brand T.
The dependent variable used for this analysis was a dichotomous indicator of whether a particular brand was purchased or not (1 = purchased, 0 = not purchased). Each participant’s recorded shopping session was viewed to verify that the stated purchases were accurate. There were two measures of visual attention that could have been used as the independent variables: the total number of fixations on each brand or the total duration of the fixations on each brand. Pearson correlations revealed a very strong, if not perfect, relationship between the two variables for each brand. Fixation duration was ultimately chosen, as it seemed more intuitive in explaining how increases in attention would affect behavior as well as its use as a measure of visual attention in previous research.
In order to understand the impact that visual attention given to brands had on shoppers’ purchase decisions, bivariate logistic regression was applied in the data analysis. A widely accepted rule of thumb provided by Hosmer and Lemeshow (2000) suggests a ratio of 10 cases per independent variable should be used in order to obtain adequately precise coefficient estimates. Thus, at least 10 participants would have needed to purchase each brand being analyzed in order to adhere to this rule of thumb. The analysis for this study included a total of eight brands of interest to our client.
Separate logistic regressions were run for each of the eight brands. The primary goal of this analysis was to determine the extent to which visual attention given to a particular brand impacted the likelihood that it would be purchased. To simplify the interpretation of the results, the model coefficients were exponentiated to allow us to think in terms of odds rather than log odds. The odds ratio represents the expected change in the odds associated with a one-unit increase in the independent variable. This means that we can predict how one additional second of gaze time on a brand will impact its odds of being purchased.
For each model, the likelihood ratio test was significant (p < .001 to p < .05), indicating good model fit. In addition, each Wald statistic was significant (p < .001 to p < .05), indicating that fixation duration was useful to the model.
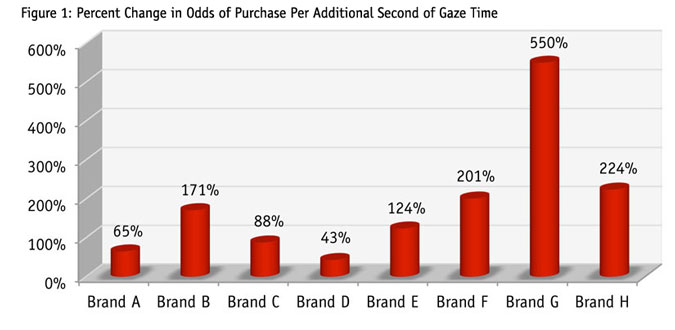
Figure 1 visually represents the percent change in odds of purchase per additional second of gaze time for the eight brands of interest.

A suitable substitute
The goal of this analysis was to determine whether participants’ stated recall of noticed brands was an accurate reflection of where they actually placed their visual attention while shopping. In other words, it aimed to answer the question: is brand-recall data a suitable substitute for eye-tracking data?
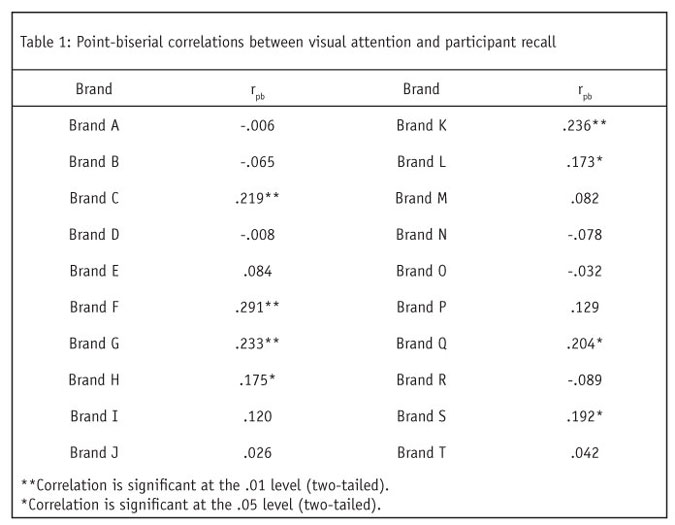
This was assessed by examining the strength of the relationship between brand recall and visual attention. The recall variable was a dichotomous indicator of whether participants remembered seeing a particular brand (1 = recalled, 0 = not recalled). Recall data was obtained from participants’ responses to a follow-up survey administered on-site immediately after shopping. Fixation duration was again used as the measure of visual attention. Since the relationship between the two variables was of primary interest here, point-biserial correlations were used to analyze the data. A moderate or weak association would tell us that the variables are not measuring the same thing and thus are not adequate substitutes for each other.
Twenty brands of interest were included in this analysis. The results are presented in Table 1. The results show that recall and visual attention had significant positive associations in only eight of the 20 brands analyzed, all of which were weak in strength. The mean point-biserial correlation was .096, indicating a negligible relationship between the two variables. This clearly demonstrates that brand recall is not a sufficient proxy for visual attention.
Answer questions
These relatively simple analyses provide eye-tracking researchers a way to answer some of the most commonly-asked questions by clients. The analysis of visual attention and purchase decisions provides an easy-to-understand and intuitive gauge of how visual attention is impacting shoppers’ purchase decisions. In addition to its use in comparing visual attention’s impact on purchase decisions among competitors, it can also be used in a variety of package and design testing situations and in assessing the effectiveness of in-store marketing materials.
Demonstrating that brand recall is not an accurate reflection of visual attention could prove useful in a number of situations. Managers may be skeptical of eye-tracking research, believing that traditional methods such as qualitative interviews and surveys could provide the same information. Prospective clients may be reluctant to embrace eye-tracking research for the same reason. Providing evidence that traditional methods cannot accurately measure visual attention can help to justify the use of eye-tracking.
References
Chandon, P., Hutchinson, J. W., Young, S. H. (2002). “Unseen is unsold: Assessing visual equity with commercial eye-tracking data” (working paper no. 2002/85/MKT). Retrieved from INSEAD Web site: www.insead.edu/facultyresearch/research/doc.cfm?did=1253.
Chandon, P., Hutchinson, J. W., Bradlow, E. T., and Young, S. H. (2009). “Does in-store marketing work? Effects of the number and position of shelf facings on brand attention and evaluation at the point of purchase.” Journal Of Marketing, 73(6), 1-17. doi:10.1509/jmkg.73.6.1.
Pieters, R., and Warlop, L. (1999). “Visual attention during brand choice: The impact of time pressure and task motivation.” International Journal of Research in Marketing, 16(1), 1-16. doi:10.1016/SO167-8116(98)00022-6.
POPAI. (2012). 2012 Shopper engagement study: Media topline report. Retrieved from www.popai.com/engage/docs/Media-Topline-Final.pdf.