
Editor's note: Joe Abruzzo is executive vice president, chief exploration officer, at Havas Media, New York.
Tracking research is an important means of monitoring brand health. How is the brand tracking on measures like unaided or total brand awareness? Consideration? Brand preference?
We are interested in levels and trajectories across a range of brand health metrics. How healthy is the brand? Where is the brand headed?
The problem is, brand health tracking measures tend to move slowly. Variation that accompanies smallish samples clouds the brand health picture. It’s difficult to decide when it’s time to celebrate or begin to take corrective action.
When working with survey data, it’s a good idea to understand what is being reported. What time interval does the data represent? How often is the data captured? Is the data being captured continuously? One week per month? One month per quarter? How many interviews represented by each data point?
Some data providers choose to “roll” their data, which means creating a moving average that reduces sample bounce and introduces stability into data trends. This may seem like a great idea. However, the individual data points are not independent. A three-month moving average means that each data point is only one-third current. Changes from one month to the next are dampened. Emerging trends may be obscured. A data set with discrete data points where each data point is independent of all previous data points helps to avoid such a problem.
Active investors in the stock and commodity markets deal with these kinds of decisions every day. Many use simple tracking systems that generate buy-and-sell signals, or, at the very least, indicate when to pay attention.
It’s common to track stock and commodity prices in comparison to the highest and lowest price observed over the most recent 52-week interval (referred to as a 52-week channel).
We can adapt this thinking to brand tracking. Imagine the feeling of breaking through to a new 52-week high on unaided brand awareness – or the disappointment of breaking through to a new 52-week low. These are two clear signals that brand health may be improving or in trouble.
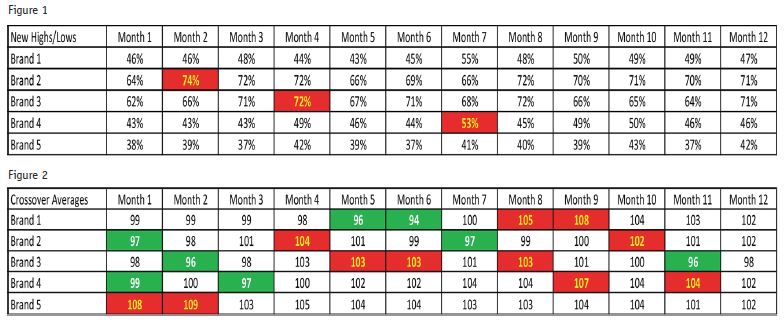
The chart in Table 1, based on unaided brand awareness data for five brands, applies the same thinking to 12 months of tracking data. Red-colored cells represent new 12-month high values, suggesting improvement in brand health. (Green coloration would be used to represent new 12-month low values.)
A second, less well-known method of analyzing movement in brand tracking measures makes use of crossover moving averages.
Imagine a moving 52-week average on a brand-health measure like unaided brand awareness. Is the 52-week average trending upward? Or is it declining? Attention is suggested when the 52-week moving average is trending down.
Imagine a shorter 13-week moving average. In comparison to a 52-week moving average, a 13-week moving average will show greater variability – but reflective of shorter-term trends. Comparing the 13-week moving average to the 52-week moving average provides an indication of change in direction.
When a 13-week moving average moves above a 52-week moving average, we have an indication that the brand-health trend is improving. When a 13-week moving average moves below a 52-week moving average, we have an indication that brand-health may be weakening. This methodology provides an early indication of emerging strength or weakness.
The illustration in Table 2 shows an index of a three-month moving average vs. a 12-month moving average. Red-colored cells are an indication of improving brand health; green-colored cells are an indication of deteriorating brand health.
There are many other examples within finance of approaches for generating the equivalent of buy-sell signals that may be applied to brand health tracking research. (The reader may wish to check out Technical Analysis in Commodities by Perry Kaufman.)
Provides limited feedback
Tracking data, by itself, provides limited feedback to brand management. Given the very large investment re-quired for tracking research, the steps outlined above provide valuable insights into brand health. Where are we? Are we headed in the right direction? Should we be taking corrective action?
The additional effort required for implementing the analysis approaches discussed above is small once the systems are in place. Microsoft Excel may be sufficient. The results are extremely useful for alerting management to reasons to take corrective action (or buy champagne).