
Editor's note: Michael Lieberman is founder and president of Multivariate Solutions, a New York data science and strategy firm.
Data. Companies have lots of it. So much that we have begun urging them to commoditize it. Or at the very least put it to practical use. With today’s technology not only can nearly everything be gathered, counted and measured but the information can be stored and then processed at record speeds. The result is analysis that goes beyond sums, averages and basic statistics to aggregates, benchmarks, recommendations and predictions. So what does one do with all of this game-changing data and analysis? Create a data product. They’re all around us and they’re changing the way we as consumers interact with companies and the way businesses interact with each other.
There are stories to be told hidden within the databases of major corporations. Traditional marketing research projects often take data that is fielded by way of panels or other field measures. While these will continue to function, an opportunity to use existing customer databases and purchased data – for example, Nielsen PRIZM segments – to apply to marketing research techniques and produce an actionable product are now becoming more prevalent.
Many companies wish to link their customer experience (CX) variables to specific financial outcomes. They wish to estimate customer retention based on data they already possess and identify variables that will predict financial performance. This article will illustrate how we would go about this.
Background
Anaheim is a fictional insurance company with a lot of data. Anaheim finds itself at a crossroads; it has accumulated massive amounts of data and has conducted a significant number of analyses. Still, it is removed from having a simple-to-implement input/output model that management can use for making investment decisions in new customer experience initiatives.
At the same time, Anaheim is confronted with a research problem: How useful are the data currently available? This data has not necessarily been collected with a view to addressing the input/output query mentioned earlier. Can it be put to use in an investment frame of reference?
Anaheim wishes to link its customer experience variables to specific financial outcomes. It wants to estimate customer retention based on data it already possesses and identify variables that will predict financial performance. We have been asked to employ our analytical methods focusing on key measures, such as the Net Promoter Score and likelihood to churn.
Current marketing research and practice aims at maximizing the correct classification of customer retentions and losses. Profit from targeting a customer depends on not only a customer’s propensity to retention but also on her spend or value, her probability of responding to retention offers as well as the cost of these offers. Overall profit of the firm also depends on the number of customers the firm decides to target for its retention campaign.
This project is an extension of typical marketing research assignments. It requires a high level of understanding of business strategy and executive decision-making in addition to a command of statistical and modeling approaches, techniques and solutions. In other words, the new role of the marketing researcher: consultant.
This linkage project requires Anaheim to advance along the continuum:
Problem definition --> Data specification --> Modeling --> Testing --> Application --> Refinement
Our objectives are outlined below.
| The business objective: | Measuring the return on investment (ROI) of programs, initiatives, campaigns, etc., in order for the company to be able to:
|
| The analysis objective: | Develop models using the data currently available to the company and/or recommend additional types of data that are not presently available, which could provide the insight required for attaining the business objectives. Explore the most likely model designs and select the ones that work best at the various levels of disaggregation e.g., market segment, population demographics, behavioral characteristic relating to segments utilization of health care delivery systems, etc. |
The scope of the work envisioned here applies to the following subgroups of Anaheim’s served market:
- Individual, small group, Medicare supplement and Medicare Advantage customers whose records are available at the individual level.
- The large group and national market segments whose records are available at the employer level.
The object is to prepare modeling recommendations that are applicable to a variety of customer levels – from market segments all the way down to specific consumer groups defined by their demographics, service usage patterns, via Net Promoter Score and other key measures.
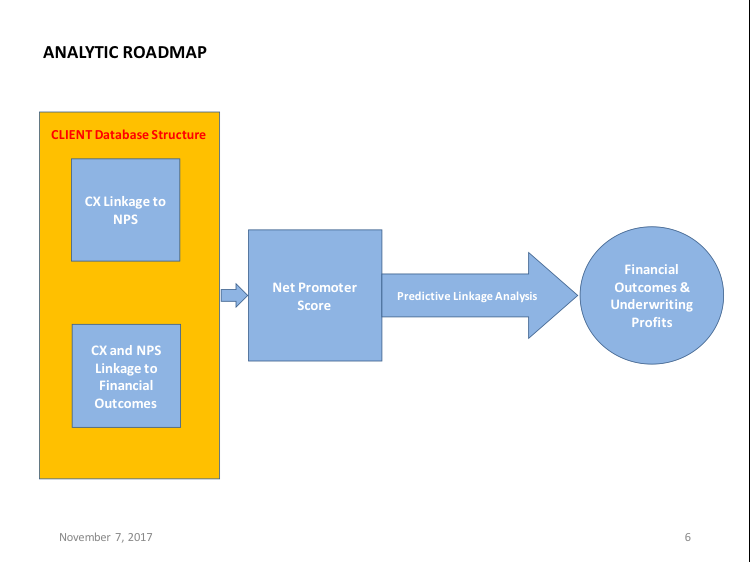
The application for detailed subgroups is critical to: (1) understand the nature of the linkages and, perhaps more importantly, to (2) provide Anaheim with the tools necessary for designing future targeted initiatives that maximize financial outcomes among the most predisposed groups of customers. That is, maximize retention to retain the most lucrative clients. Plainly put, let the data tell the story and then point us to Anaheim’s premium clients. The project frame is illustrated below.

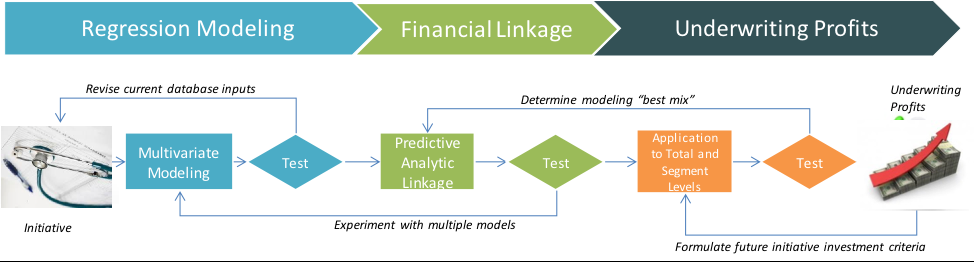
At the conclusion of the project we expect to be in a position to create a road map for the ensuing analyses. The modeling process will work to getting over the “understanding the data” roadblock with utmost speed. Below is a flowchart of how we would work to uncover Anaheim’s path from CX to financial outcomes.
While the final choice of modeling approaches will depend on many factors, the most critical is the form and structure of the data. Many company databases are full of empty cells and old, irrelevant data. Anaheim’s was no exception. Usually a good scrubbing in SPSS or creation of dummy variables is a necessary best practice.
Before we explore an overview of the methods we have used successfully in the past on similar projects as well as methods that we judge to be directly applicable to the case at hand, here are two rules of thumb I keep in my frontal lobe during the cleansing process.
- While, as a rule, it is advisable to minimize the number of models used as one tries to develop an optimal solution, we realize that this project’s specific requirement – providing the best possible linkage for a multitude of groups and subgroups – may lead us to recommend that unique algorithms be used in each subgroup or several subgroups taken together.
- During the first step along the analytic track these models will most likely be based on regression analysis. These will be followed by predictive analytic techniques designed to uncover the linkage between our performance model and financial data.
The availability of powerful, open-source software and the expansion of bandwidth to transport ever-growing amounts of data have allowed marketing scientists to easily access tools which used to be available in expensive software such as SAS. Ten years ago these were most common in the predictive analytics industry. Today they are common across all quant endeavors and allow other marketers to utilize the same powerful algorithms. Across the board, we will be using any of the analytic approaches in our scientific repertoire. Below is a list of the most common approaches.
- Bayesian inference
- CHAID trees
- General linear models
- Logistic regression
- Neural networks
- Monte Carlo simulation
- Feature selection regression
- Machine decision list functions
Ultimately, our aim is to provide Anaheim management with the necessary tools to answer questions that link initiatives that carry capital, operational costs (CAPEX or OPEX) or both to financial outcomes and to identify consumer-derived variables that are the best predictors.
The flow outlined here illustrates the process we propose to implement in order to satisfy the requirements of the ROI project. While “perfect” data is never available in any project based on retroactive data, it is always our aim to “drive out” the best possible results of the existing data while helping to align the organization with the “ideal” state.
The ideal state is when a corporate marketing research department can put management decision makers in front of a “control center” display that permits computer simulation of various action è outcome scenarios. Commonly-known analytical approaches such as regressions, Monte Carlo simulations and neural networks are candidates for computer simulations that can be placed into Excel-based simulators that may be distributed company-wide, providing a full-service solution.
Data products incorporate data science into the operation of a product or service, using data in smart ways to provide value. It's more than just analysis, it's putting insight into production. The emphasis emerging in corporate America is to use the existing, ever-growing stockpile of data to complete concrete ROI outputs. This is the new frontier of the marketing research industry.