A more direct measure
Editor’s note: Michael S. Garver is a professor of marketing at Central Michigan University, Mount Pleasant, Mich.
Customer satisfaction research gained widespread adoption in the 1990s by being aligned with a total quality management philosophy with a relentless focus on continuous improvement. No matter what level of performance the firm is currently achieving, a continuous improvement philosophy suggests that firms identify and prioritize ways to do better.
One of the main objectives of customer satisfaction research is to identify what product and service attributes should be prioritized for continuous improvement efforts, as suggested by customers in the marketplace. Practitioners need to know what attributes should be targeted for continuous improvement efforts and how those attributes should be improved.
Currently, most customer satisfaction researchers obtain attribute importance scores and relative satisfaction scores, then infer improvement priorities by examining both attribute importance and relative satisfaction data via performance-importance analysis (also known as quadrant analysis). Researchers have identified a number of issues and limitations with measuring attribute importance and satisfaction, as well as analysis methods used in conducting performance-importance analysis. These issues and limitations call into question the validity of inferring improvement priorities from this approach. As a result, a number of researchers now suggest that researchers should begin to directly measure improvement priorities instead of or in addition to using more traditional approaches that infer improvement priorities (Bacon 2003; Waddell 1999).
The purpose of this article is to put forth a new approach for directly measuring continuous improvement priorities within customer satisfaction research. A new application of maximum difference scaling is employed that can be used at a strategic level to identify overall improvement priorities or at a more tactical level to suggest specific improvement efforts. This article gives an overview of maximum difference scaling and its use in identifying continuous improvement priorities, followed by an empirical demonstration of this method.
Popularity rapidly increasing
Maximum difference scaling (also known as best-worst analysis or best-worst conjoint analysis) has been around for the past 20 years, yet the popularity of this technique is now rapidly increasing every year. While leading-edge researchers have used maximum difference scaling in a variety of ways, the majority of research studies published in the literature have used maximum difference scaling (MD) to prioritize a list of attributes, with the most common application being attribute importance analysis. Chrzan and Golovashkina (2006) examined the most popular research methods for determining attribute importance and found that MD was the most valid and accurate research method for the job. While attribute importance has been the most popular application, MD can be used whenever researchers are struggling to get adequate variation in their results. MD may be a viable method when respondents “can’t have it all.” Customers make difficult choices every day with limited resources and MD is aligned with this reality.
To create a MD survey, a list of attributes would be entered into an experimental design plan, with the experimental design plan specifying which attributes would be compared in each MD question. Typically, four or five attributes are shown in one MD question and the customer is asked to choose the “best” and the “worst” item from the list. On average, depending on the number attributes, each respondent may answer between 10 and 15 MD questions. MD choice data are analyzed with counting analysis, latent class analysis or hierarchical Bayes. Typically, the results are then rescaled to ratio-level data, with the attributes scores summing to a total of 100.
Two different methods
This article proposes two different yet related methods for directly measuring and identifying improvement priorities - including both strategic improvement priorities and tactical improvement priorities.
Strategic improvement priorities
Before specific improvement plans can be created, the first step is to identify the attribute(s) that customers most want to be improved. In the strategic improvement priority stage, the researcher is looking for the general area of the firm’s offering that needs improvement. For example, do customers want to see improvements in product quality, technical support or customer training? In this situation, the researcher designs the MD study so that participants choose the “most needed to be improved” and “least needed to be improved” attributes from a list of four to five product and service attributes.
When implementing strategic improvement priority analysis, the attributes would be the same as or similar to those attributes currently used in the firm’s relationship customer satisfaction survey. The results from this analysis would be at the same level as the results from traditional performance-importance analysis.
Tactical improvement priorities
One of the biggest complaints by practitioners - How do we act upon the data? - is addressed in this stage. In typical customer satisfaction research, it is often difficult to know exactly how to improve an attribute once it is slated for improvement efforts. For example, if technical support is prioritized for improvement, which aspect of technical support needs to be addressed? Is it wait-time to talk with a representative, first-call resolution or the knowledge level of technical support representatives?
While there are methods to overcome this problem (open-ended comments, drill-down questions, etc.), most satisfaction research is not very effective in providing precise guidance of exactly how attributes should be improved.
Implementing the tactical improvement priority method, specific improvement efforts are put forth and then tested within MD. This method assumes that the strategic improvement priority has been utilized and the appropriate strategic direction of improvement efforts has been identified. Now, specific plans to improve the overall attribute(s) are put forth. Keeping with the example above, what aspect of technical support would you rather see improved? Would you most prefer to see “wait-time to talk with a representative” improved, “first-call resolution” improved or “knowledge level of technical support representatives” improved? Consistent with the strategic improvement priority method, the researcher designs the study so that participants for each MD question choose the “most preferred to be improved” and “least preferred to be improved” solutions from a list of four to five solutions.
Facebook as the research context
To empirically demonstrate the strategic improvement priority method, Facebook was chosen as the research context. The goal of the analysis was to identify those attributes that had relatively higher improvement priorities so that continuous efforts could be aligned with the needs of the marketplace.
To develop a list of strategic attributes, interviews and focus groups were conducted with avid Facebook users. Then, this list of attributes was shown to another group of Facebook users, whose feedback was used to refine the list, resulting in 18 attributes.
Implementing max-diff within Sawtooth Software’s SSI Web software (version 7), the 18 attributes were entered into an experimental design plan, with five attributes shown per MD question. A total of 11 MD questions were asked, with each attribute shown with different attributes in each set. For each question, respondents were asked which of the five Facebook features (such as company profiles, status updates, chat) “most needed to be improved” and “least needed to be improved.”
To be included in the sample, respondents were first qualified by responding that Facebook needed improvement efforts. In the final sample, 574 respondents were invited by e-mail, with a password-protected link to take the survey. From this activity, 538 emails were successfully delivered, with 212 respondents completing the survey. After cleaning the data, 203 respondents remained in the sample, for a response rate of 39 percent.
Results
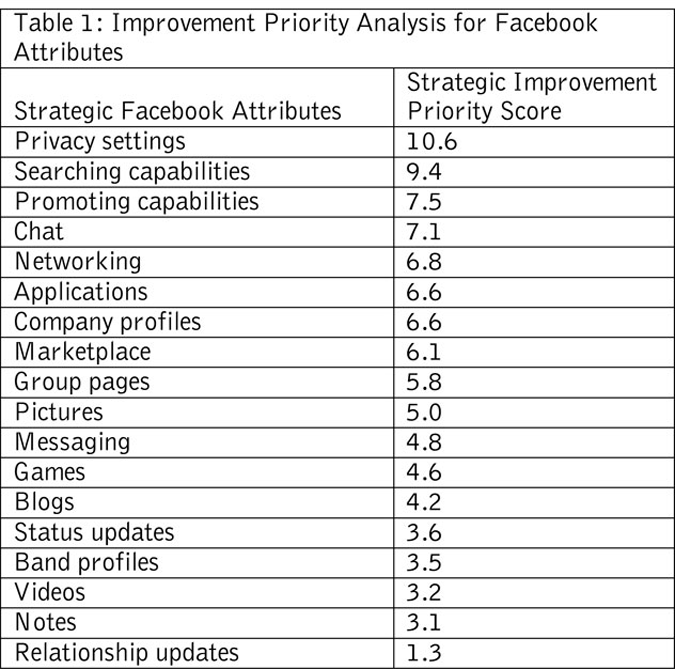
After the data were collected, a hierarchical Bayes application of multinomial logit analysis was used to analyze the data, with the results being imported into SPSS. The mean scores from this analysis are included in Table 1. The top two strategic improvement attribute scores include privacy settings (10.6) and searching capabilities (9.4).

Given the relative magnitude of the improvement scores, privacy setting and searching capabilities would most likely be prioritized for improvement. Improvement scores for privacy settings and searching capabilities are significantly higher than any other improvement attribute score (p value <.05).
TURF (total unduplicated reach and frequency) analysis is a popular technique that optimizes a product portfolio to maximizes total reach to the marketplace. While TURF analysis has most often been used in a consumer retail context (i.e., what mix of brands will reach the most consumers?), TURF analysis can also be used with MD improvement priority data. For example, what three “improvements” would have the most impact or greatest reach of satisfying the marketplace? While this is a relatively new application for TURF analysis, it can help researchers prioritize improvement efforts.
TURF analysis results using the first choice method are included in Table 2. The results tell an interesting story. The analysis was run to determine what attributes would be prioritized for improvement if only two, three or four attributes could be selected.
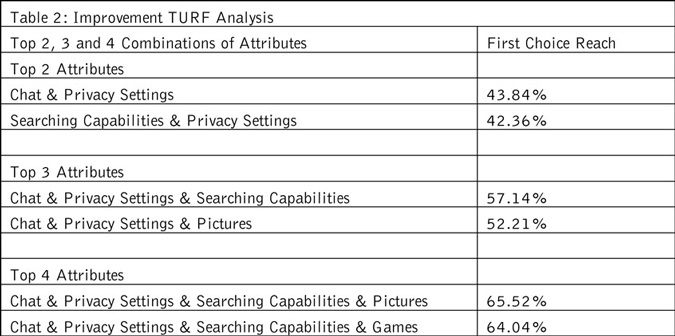
Consistent with the overall results, privacy settings and searching capabilities are commonly identified in each analysis. In contrast, some attributes rise to the top that had relatively low rankings and improvement scores in the overall analysis. For example, chat is ranked fourth in overall results, but is prioritized substantially higher in TURF analysis. Pictures (tenth) and games (twelfth) and are ranked relatively low in the overall results, but are prioritized substantially higher in TURF analysis when three- and four-attribute combinations are examined. This demonstrates the usefulness of TURF analysis for prioritizing improvement efforts.
The average customer does not exist
Not all customers are alike in their preferences for improvement. In short, the average customer does not exist and improvement-based segments will deliver more insight into the marketplace. With this in mind, latent class cluster analysis (Latent GOLD 4.0) was used to segment the market based on their strategic improvement scores. After running a number of analyses, a three-segment model was determined to be the most appropriate segmentation model (i.e., AIC, BIC, classification errors, segment profiles and segment size).
Table 3 contains the improvement scores directly measured by MD for each segment, along with the size of each segment. The smallest segment captures 20 percent of the sample, while the two largest segments both account for 40 percent of the sample. Each attribute improvement score is significantly different (p values <.05) across the three segments.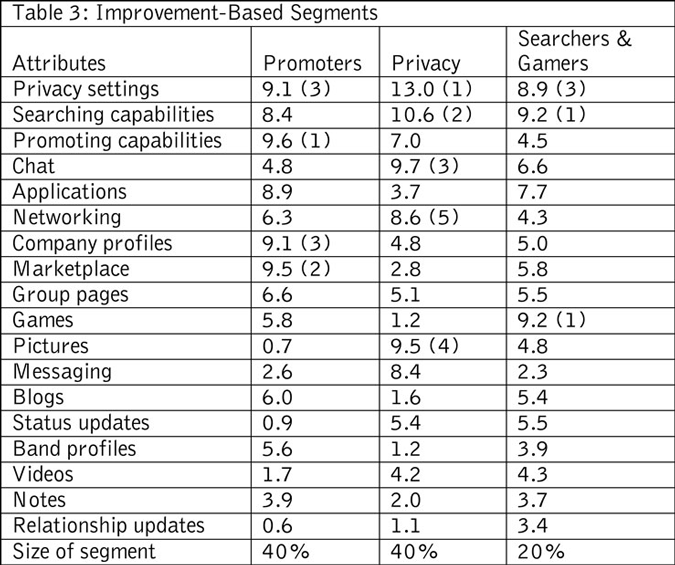
The three resulting segments are named according to their primary improvement priority, and include the following: the Promoters, the Privacy Guys, the Searchers & Gamers.
Clearly, the Promoters segment has a focus on improving Facebook’s commerce-related activities. This segment places the highest preference on improving the promoting capabilities (9.6) of Facebook, followed closely by improving the marketplace (9.5). Both of these improvements are commerce-related. The next highest preferences for improvement include company profiles (i.e., also commerce related) and privacy settings.
The Privacy Guys place the highest scores on improving privacy settings (13.1) in Facebook. Without question, this segment’s focus is on improving privacy settings. While all segments have relatively high improvement scores for privacy settings, this segment has significantly higher scores for this attribute. In addition, the privacy settings score is also significantly higher than the remaining attributes for this segment. It should be noted that pictures has a much higher improvement score for this segment, which is consistent with TURF analysis results.
The Searchers & Gamers segment place the highest preference on improving both searching capabilities (9.2) and gaming capabilities (9.2) within Facebook. This segment’s preference for searching and gaming capabilities is also consistent with TURF analysis results. Their third preference for improvement is privacy settings (8.9).
Examining the three segments, some of the attributes have high improvement scores for all segments. For example, privacy settings and searching capabilities are relatively high on the list for all segments. This is consistent with the overall results and TURF analysis. In contrast, there are attributes that have relatively low average improvement scores for the sample, yet have high improvement scores for a particular segment. For example, improving gaming capabilities and pictures within Facebook are relatively low for the sample, but very high for individual segments (these also rank high in TURF analysis). Likewise, company profiles and marketplace also have relatively low improvement scores for the sample, but high for one segment in particular.
Absolute versus relative scores
Typically, MD scores are rescaled to ratio-level data where the scores of all attributes sum to a total of 100. This has long been touted as a benefit, since attribute scores can be directly compared to each other. For example, attribute A with a score of 20 is twice as important as attribute B with a score of 10.
The goal of this study was to identify those attributes that had the highest relative improvement scores, so that the firm could focus on those attributes that needed the most attention. Thus, relative scaling of MD results is justified for this study.
As of late, however, the relative nature of MD scores has been discussed as a limitation in certain research contexts (Bacon, Lenk, Seryakova and Veccia 2008). In response to this issue, researchers are putting forth and testing methods to determine the best way to obtain more absolute or anchored MD scores. While a variety of methods are currently being developed and tested, most of the absolute methods have respondents answer additional survey questions in addition to the MD exercise, which are then modeled to obtain more absolute MD scores.
At this time, the jury is still out on what contexts require more absolute scaling, as well as the best method for conducting this analysis. Because absolute scaling requires more respondent time and effort, as well as analysis time and effort, researchers need to put forth a solid case why absolute scaling is necessary. Future research is needed in this area to determine those situations in which absolute MD scaling is necessary, as well as the best method to implement absolute scaling.
Moving forward, if absolute scaling is deemed appropriate for measuring either strategic or tactical improvement priorities, then additional survey questions are necessary in addition to the MD exercise. For strategic improvement priorities, these survey questions need to determine whether certain attributes need to be improved. For tactical improvement priorities, these survey questions need to determine whether proposed solutions are preferred.
Directly measure
Currently, most customer satisfaction researchers infer improvement priorities by examining both attribute importance and relative satisfaction data via performance-importance analysis. Based on limitations and issues of this approach, this article proposed two MD applications to directly measure and identify continuous improvement priorities, which included the strategic improvement priority analysis and the tactical improvement priority analysis.
References
Bacon, D., (2003). “A Comparison of Approaches to Importance-Performance Analysis.” International Journal of Market Research. Vol. 45 No. 1, pp. 55-71.
Bacon, D., Lenk, P., Seryakova, K., and Veccia, E. (2008). “Comparing Apples to Oranges.” Marketing Research. Vol. 20 No. 1, pp. 29-34.
Chrzan, Keith and Golovashkina, Natalia (2006). “An Empirical Test of Six Stated Importance Measures,” International Journal of Marketing Research. Vol. 48, No. 6, pp. 717-740.
Waddell, Howard (1999). “A Better Customer Satisfaction Scale.” Quirk’s Marketing Research Review. October.