Editor's note: Morris Wilburn is a marketing research consultant at Advanced Customer Analytics, Lawrenceville, Ga.
Maximum difference scaling (max-diff) is usually used in marketing research for two purposes. One purpose is to measure the relative importance (to the respondent) of the attributes of a product. The other is measurement of the relative preference for products or product concepts. Particularly in the latter case, after the max-diff analysis has been completed, the analyst is left with the question, “Why?” As in, why did respondents prefer a given product or product concept over another? This article uses a recent study to illustrate how this question can be addressed in the max-diff analysis.
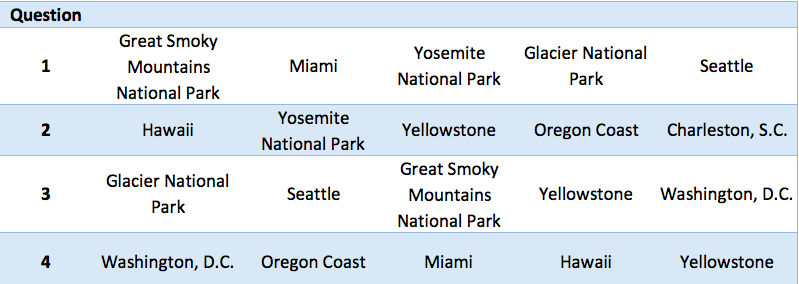
The study looked at the relative appeal of 10 vacation locations. In the max-diff exercise, each respondent was shown a series of combinations of five locations and for each combination asked to identify the most appealing and least appealing location. Four of the combinations are shown in Figure 1. Our decision of how to group the vacation locations into combinations and the total number of combinations (36) was made using experimental design principles. The design was close to being perfectly balanced. By definition, the design would be perfectly balanced if each vacation location appeared an equal number of times across the 36 combinations and each vacation location appeared with (in a combination) each other vacation location an equal number of times.
Figure 1
The 36 questions were divided into three sets of 12 and each respondent was assigned one set. (The total sample size in this study was very small, only 30; we would have designed more sets had the sample size been larger). Each set was close to being perfectly balanced.
Experimental design principles were used at this point as well. Even though the 36 were almost perfectly balanced, had the 12 been chosen at random from them, some vacation locations could have appeared as few as three times across the 12, while others appeared as many as eight times. Some vacation locations could have appeared together as few times as never, while others appeared together as often as eight times. This would degrade the validity of the data. Unfortunately, this issue does not always receive as much attention as it deserves.
The multinomial logit model, with a customized data organization, is widely used in the industry to analyze max-diff data. We used the conditional logit model here for two reasons. One is that it is better suited to handle respondent-level variables. The other reason is that philosophically it is better suited. The relative appeal scores produced by the analysis are found in Figure 2.
Figure 2
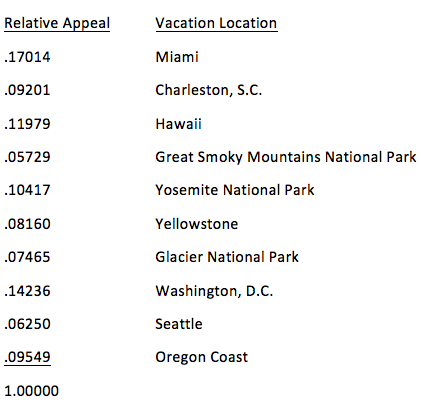
The technical interpretation of these values is that they are the probabilities of the average respondent choosing a vacation location as most appealing were all 10 locations simultaneously shown.
The questionnaire also contained questions regarding desired characteristics of a vacation location. The final model contained one of these questions, regarding desired weather (warm/cool). The coefficients having to do with this variable are shown in Figure 3. These coefficients express the effect of desired weather on the likelihood of a location being chosen as most appealing.
Figure 3
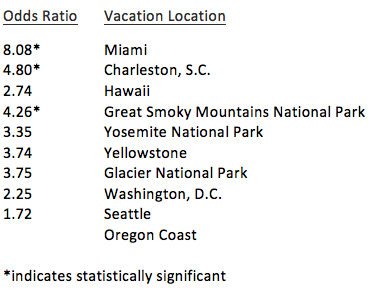
These coefficients are in the form of odds ratios. The key to interpreting them is to know that in the case of categorical variables, statistical analysis programs use one of the categories, usually whichever category coded last, as a “contrast group.” In Figure 3, the Oregon Coast is the contrast group. Utilizing this understanding, the coefficients have the following interpretation: using Miami to illustrate, a respondent preferring a warm climate is 8.08 times more likely to choose Miami than the Oregon Coast. By choose I mean pick as the most appealing in the max-diff exercise.
Interpreting the results
Knowledge of the product category is required to correctly interpret the results of this analysis. Given a large enough sample, all of the odds ratios would be statistically significant, even the odds ratio for Seattle. But would that mean that Seattle is more preferred than the Oregon Coast because of warm/cool weather? No. The reason for such a finding would be that respondents are influenced by factors in addition to climate and some of those factors are statistically correlated with preference for cool weather.
The statistical significance of the differences between odds ratios can be tested.
Odds ratios also have a property that few measures of strength of association have: their magnitude is not affected by the distributions of the variables. Most measures of association are depressed to the degree that the distribution of either variable is skewed.
Multiple (a dozen or more, depending on the study) respondent-level variables can be in the model at the same time. They can be dichotomous, categorical with more than two categories or metric.
The application of this to product and concept testing is evident. Product category-specific attitudes, benefits desired, demographics, etc., can be included in the model to help us understand the “why” of consumer preference.