Editor's note: Michael Lieberman is founder and president of Multivariate Solutions, a New York-based research firm.
Without the right model, more data can mean less information
My job as a data scientist and research strategist is getting easier. Over the past 50 years, statisticians have developed a number of practical models that are highly effective in explaining consumer patterns and predicting consumer behavior. As new forms of computing power and information technology provide descriptions of individual-level purchasing tendencies, these models offer great value for business managers.
An example of the advances in technology is the R-stat caret package, developed to create a unified interface for modeling and prediction. It interfaces to 147 models, meaning that this package runs 147 different methodologies on one data set (that does not have to be big) and spits out what amounts to a crowdsourced outcome that is far more efficient than any single model. The cost? Nothing. R-stat is an open-source software. Difficulty? Low. Any data scientist with a moderate knowledge of R can plug in the data, run the caret package and output the mixed predictive outcome to estimate, say, the probable traffic to a Web site given an advertising campaign.
My job as a marketing researcher, however, is getting more difficult. A common problem is the big data fallacy: the more data that is thrown at a problem, the more accurate the model. In fact, these days there is more data and less information. Confusion around business problems is leading to more and more paralysis among decision makers.
Predicting future behavior
Let’s look at a sample problem. Say a company has data and would like to use this data to predict future customer behavior, the amount of foot traffic that passes a potential store location and the number of donors who may potentially repeat or exceed their past donations.
A probability modeler approaches these problems with the mind-set that the data (observed behavior) will predict future behavior. There are unknows. If a customer purchased 12 items at a store, how many will she purchase in the next visit? In what shape is the data distributed? In other words, which distribution was it in the past and will it be the same in the future?
Or, let’s say a company has launched an app. How does one calculate customer lifetime value on an app with an unknown lifespan? The app could be obsolete in one year – or five.
The R-stat caret package helps us with the computing power to solve all of these issues but where do we begin?
In their many writings on probability marketing, Peter Fader and Bruce Hardie have coined the phrase analysis setting. In some of their writing, they define what they see as a product quadrant which is essential to classify before any predictive modeling is applied. As I read their work, I came to realize that many in the research and marketing world do not automatically classify their products into quadrants.
Classifying customer bases
Before we move ahead, we need to classify different kinds of product settings that will advance the choice of modeling approaches. Please consider the two statements below.
- In its 2017 annual report, Charter Communications, parent company of Spectrum, announced, “In the fourth quarter, total video, Internet and voice customers increased by 15,000, 300,000 and 53,000, respectively. Fourth quarter total residential and SMB customer relationships increased 206,000, compared to 243,000 during the fourth quarter of 2016.”
- In a Q4 2017 financial results conference call, Shopify announced, “Total revenue in the fourth quarter was $222.8 million, a 71 percent increase from the comparable quarter in 2016.”
On the face of it, these two financial statements seem to be similar. However, the modeler is most interested in the number of customers in order to build a predictive model. Charter Communications earns income by subscriptions, whereas the e-commerce site Shopify reports income based on sales. Will a customer who spent $1,000 in Q4 of 2017 spend the same in Q1 of 2018 on Shopify? This is information we do not know. Shopify’s report points toward active customers but does not specify a period of time. Was it one year? Nine months? This sort of relationship is termed a noncontractual setting, as Hardie and Fader say, “a time at which the customer becomes inactive is unobserved by the firm.”
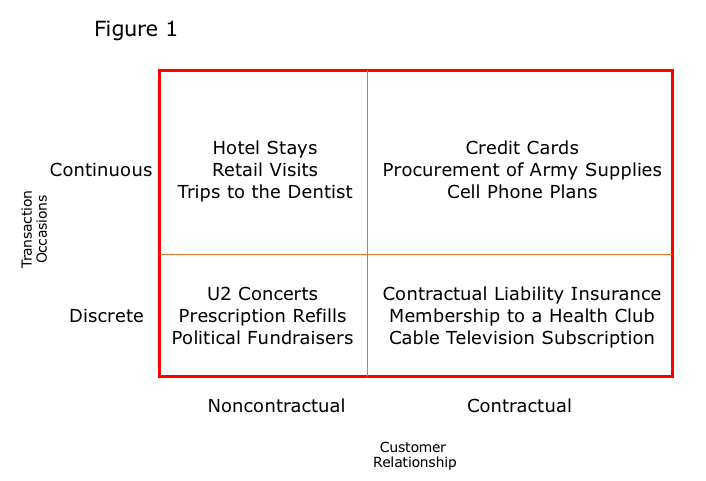
Spectrum’s customer relationship, on the other hand, is finite and based on a subscription model. Thus, we know when a customer is in or out and how much they will spend. This is termed a contractual setting. Together these two make up the X-axis of our product quadrant.
Now consider the difference between these four types of products: airport lounges (e.g., American Airlines Admirals Club), water utilities, non-profit fund-raising galas and online Walmart shoppers. The first two are contractual. The last two are clearly not contractual. There is no reason for a past supporter to call the organization to say he is not going to attend its annual fund-raiser. A shopper at Walmart could die and the store would not receive a death certificate.
Examining the first and third transactions, we see that they are discrete – that is, they occur at a particular point in time. The fundraiser occurs on a certain date. If that date is June 15 no one is concerned if an attendee wants to attend on June 5 or July 30. For the Admirals Club, membership expires on a certain date; the member decides if she wants to renew or not.
Looking at the second and fourth transactions, these are non-discrete, usually termed as continuous. As long as one occupies his residence, he must pay his water bill (if he wants running water). Regarding online Walmart shoppers, no one can predict when a customer will shop. It can happen at any point in time.
These illustrations lead to a product quadrant, as shown in Figure 1, with example products in each quadrant.

Using the correct methodology
Data about our browsing and buying patterns are everywhere. From credit card transactions and online shopping carts, to customer loyalty programs and user-generated ratings/reviews, there is a staggering amount of data that can be used to describe our past buying behaviors, predict future ones and prescribe new ways to influence future purchasing decisions.
It is important for brand strategists and research practitioners to gain fluency in the language of data models. As with most projects, begin at the end and work backwards. A modeler will know which quadrant a product falls into, and thus develop the correct methodology. It is a matter of data translation and the brand strategist must understand the lingo.