On the face of it
Editor's note: Dan Hill is president of Minneapolis research firm Sensory Logic Inc. Aron Levin is professor of marketing and director, marketing research partnership program, at Northern Kentucky University, Highland Heights, Ky.
Researchers have expanded beyond traditional measures of recall and attitude toward an advertisement and now tend to agree that a more comprehensive approach to measurement is warranted. One of the more promising avenues of research on advertising effectiveness continues to be measurement techniques that assess consumers’ emotional responses to advertisements. If indeed it’s true, as Gerald Zaltman has pointed out, that 95 percent of consumers’ “thought” process is below consciousness, then measures that go beyond consumer self-reported surveys could have distinct advantages at predicting an ad’s impact on the target market.
This article uses facial coding to measure college students’ emotional reactions to a series of advertisements from the 2010-2012 Super Bowl television broadcasts. Of particular interest is how a specific facial coding technique compares to other emotion-based measures and more traditional self-reported surveys at predicting sales of advertised products.
Primarily intuitive
Advances in brain science over the past 25 years have firmly documented that people are primarily intuitive, sensory-emotive evaluators and decision-makers. As recently as a decade ago, the Advertising Research Foundation (ARF) maintained the orthodoxy that people’s thought process in response to advertising followed a think>do>feel model. In other words, a conscious, cognitive evaluation of the TV spot and the utility of the product as showcased in the TV spot was supposedly the determiner of whether a sale resulted from the TV spot’s airing or not.
By contrast, we suggest that the more realistic model for consumer decision-making is actually sense>feel>think>do, in keeping with the fact that over 95 percent of people’s thought process happens on a less-than-fully-conscious level and that sensory impressions and our emotional responses to them are anchored in parts of the brain whose origins go back hundreds of millions of years. The sensory (reptilian) brain and the emotional (mammalian) brain work hand-in-glove. The rational (human) brain is considerably younger, which in evolutionary terms means it is estimated to be 100,000 years old. We believe that many of the traditional methods of research focus on the rational brain, which evidence shows is not what truly drives most decisions.
To put this notion of different parts of the human brain with different functions into the context of the current study, consumers viewing TV spots don’t think their feelings, they feel them. So, resorting to a traditional series of cognitively-posed questions with input most often given as ratings is an open invite for test participants to provide intellectual alibis (i.e., good, defensible explanations that may not bear any relation to motives and preferences). As J.P. Morgan said, “A man makes a decision for two reasons: the good reason and the real reason.” The advances in brain science would suggest that the real reasons often reside in the realm of what people can’t or won’t say, whereas traditional market research resorts to documenting the “good” reasons instead.
To change that paradigm, a host of scientific research tools have been gaining prominence in recent years, as acknowledged in part by the ARF’s recent neuromarketing task force that evaluated new research tools worthy of regard. Among them, and the tool at the heart of this study, is facial coding.
Shown promise
Three types of emotions-based research methodologies have shown promise at capturing consumers’ emotions to products, services and advertisements. They are EEG, fMRI brain scans and facial coding.
EEG. Included among the ranks of EEG practitioners is Sands Research, which since 2008 has been running an annual Super Bowl ad study using electroencephalogram (EEG). This tool involves attaching electrodes to the scalp via a kind of “bathing cap” that holds them, meant to monitor the brain’s electrical activity. Widely respected as a means of getting split-second timing regarding brain activity, EEG on the other hand suffers from lacking in spatial ability what it enjoys temporally: accuracy. Not only is the emotional, mammalian brain deep inside the skull and thus relatively inaccessible to the readings taken by the EEG electrodes, gaining any precise readings of the numerous, intricate parts of the brain not on or adjacent to the surface is likewise a problem for EEG.
FMRI. Methods of neuroscience such as functional magnetic resonance imaging (fMRI) have led to breakthroughs in the relatively new areas of neuroeconomics, neuromarketing and decision neuroscience. The basic goal of neuromarketing is to gain an improved understanding of the neural mechanisms underlying consumer behavior, providing marketers with greater insight into consumers’ feelings about products and motivations for purchase. FMRI studies use changes in blood flow that accompany neural activity in different parts of the brain to associate these areas to particular behaviors. However, fMRI studies typically have small sample size due to financial constraints. Furthermore, the complexity of the brain (10 billion neurons), the imprecise time lag involved in tracking blood flow peaks and the invasiveness of the technology create practical limits for the tool’s use in market research.
Facial coding. Charles Darwin was both the first scientist to take emotions seriously (as a survival mechanism) and also the first to realize that in your face you best reflect and communicate your emotions. That’s true because of three reasons: universality (how we emote is hardwired into the brain and transcends factors like gender, age, race and culture to the extent that even a person born blind emotes in the same ways that others do); spontaneity (the face is the only place in the body where the muscles attach right to the skin, enabling essentially real-time data given a brain-to-face connection via the facial muscle nerve that sits right below the ear); and third, abundance (human beings have more facial muscles than any other species on the planet).
A century later, Darwin’s initial discoveries were codified into the Facial Action Coding System (FACS) by Paul Ekman and his collaborator Wally Freisen. Their classification is based on recognizing which facial muscle movements (called action units or AUs in FACS) correspond to which of the seven core emotions of happiness, surprise, sadness, fear, anger, disgust and contempt. This system provides a means of capturing, identifying and ultimately quantifying emotional response across cultures, and in functional, operational terms of being able to do so without attaching invasive, unnatural sensors or sliding people into a tube as is true of fMRI brain scans. The current study uses a technique for measuring facial expressions, and corresponding emotions based on the Ekman and Freisen FACS method.
Methodology
Careful consideration was taken to find ads that aren’t product-centric and are, instead, brand-related. Moreover, those companies who ran more than one TV spot during the same Super Bowl for the same product were excluded because of the lack of precision in separating out the effects of multiple ads. Finally, other candidates for exclusion were those TV spots that didn’t air nationally or those where the sales data proved difficult to secure in meaningful terms.
For this study, a set of 13 TV spots from the 2010-2012 Super Bowls served as the basis of this measurement of consumers’ emotional reactions to ads and its connection, or lack thereof, with actual sales data of the advertised products. They’re all taken from the automotive sector for the very practical reasons that car units sold represent major purchases and are carefully and rather publicly tracked by specific models.
Sample and procedure
A group of 120 undergraduate students from Northern Kentucky University and Emerson College viewed 13 TV spots aired during these Super Bowls. Sales data for the cars advertised was obtained from GoodCarBadCar.net, which uses sales data from auto manufacturers and Automotive News Data Center. We were primarily interested in changes in sales from January to February in 2010 to 2012 to determine what lift, if any, the Super Bowl ads may have brought to the cars being advertised. Of course, we recognize that many variables account for the sales of cars but in the case of this study we focused on Super Bowl advertisements.
After a brief orientation and explanation of the procedure, participants were shown a battery of TV spots ranging in number from six to 15 depending on the stage of testing. (Note: Not all TV spots tested were used in the final report because of criteria cited earlier, related to sales data.) The TV spots themselves ranged in length from 30 seconds to 75 seconds and were shown to the participants in a randomized order using a laptop computer with either a built-in Webcam or one equipped with a Logitech camera.
To code the facial expressions of this study’s sample, a trained and experienced coder adhered to EMFACS (the emotions-oriented versions of the Facial Action Coding System). It involves 23 different muscle movements, known as action units. Seven involve activity involving the eyebrows, eyes, forehead or nose. The others are revealed in proximity to the mouth. The trained coder who conducted this analysis followed a process that involved watching all the video files for a given test subject as a block of video. This approach has the advantage of acclimating the coder to each person, in turn, growing familiar with their baseline temperament or emotional disposition. For instance, a person who is generally dour – with, say, the corners of the mouth turned downwards as a more or less permanent, resting position – then needs to have that expression deepen still further or be relieved for it to qualify as an expression.
Once acclimated to a subject by reviewing their responses across one or more stimuli exposures, the coder is ready to begin careful coding. This step requires watching each video on a desktop computer, while using programmed software inside a facial coding studio that allows the coder to more easily freeze-frame, slow-motion and replay the video on a frame-by-frame basis, at 30 frames per second. On a first pass, a coder watches for where the obvious expressions fall in general terms and may stop to enter the appropriate AU code or codes in the facial coding studio as these AUs become evident. Another approach is to note on a pad the approximate timing, then, on a second pass-through, control the video on a split-second basis to detect when exactly the peak of the expression occurred and enter the data in the studio system.
On occasion, such as when an expression is very subtle or more than one AU is involved, it may be necessary for a coder to replay, freeze-frame and otherwise study the video until everything is resolved and identified. In some cases, of course, an expression occurs, then reoccurs. In that case, each new peak of the expression during the passage from onset to the offset of the expression is tagged.
For our study, the various TV spots seen by a given test subject were coded. On average, it takes about four to five minutes to facially-code every 30 seconds of viewing response. But there are certainly many instances where the subject has little to no response; they are not emotionally engaged by what they are seeing. Alternatively, there are numerous instances where a person may emote a lot, requiring extensive coding. Data from the coding are organized on an overall, aggregate basis and also on a second-by-second analytical basis.
After the exposure, depending on the stage of testing, the participants were either asked to provide a 30-second response to a purchase-intent question (How likely are you to recommend this product to a friend?), which was also facially-coded; a 1/low to 7/high purchase intent rating (also facially-coded). (Note: Response data cited in this study were drawn from only the ratings exercise.)
Correlation results
Since 1988, USA Today has published survey results within the week after that year’s Super Bowl announcing readers’ preferences among the Super Bowl TV spots just aired. Sample size for the surveys is typically around 300 respondents. In USA Today’s Ad Meter, respondents rate ads on a scale of 1-10, where 1 is the lowest and 10 is the highest.
The longevity of the USA Today poll and Sands Research data allowed us to draw on possible correlations for the TV spots in our data set. USA Today’s Ad Meter was the weaker of the two with an R2 of only .015. Sands Research data revealed an R2 of .054 for its arousal data. As we will show, facial coding in this study was shown to be more successful at predicting sales than USA Today and an EEG measurement.
Results based on facial coding
Facial coding naturally lends itself to reporting consumer emotional response data in numerous potential ways. The scoring system used for this study takes the 23 action units from FACS and ascribes to each of them the following: a specific impact or intensity score; a specific appeal or valence score; and can also detail the percentage of specific emotions felt based on FACS’ correlation of each of those action units of muscle activity to one or more of the seven core emotions cited earlier. The AU impact and appeal scores are based on taking into account the innate qualities of each AU as expressed on people’s faces. For instance, there are several ways in which anger gets expressed, using different AUs, in ways that could be described as ranging from mere annoyance to outrage. The stronger the way of expressing anger, the more negative the appeal score and the higher or more intense the impact score. Conversely, there’s a difference between a true smile (joy) and a tepid social smile, such that in this case a true smile will receive a higher, more impactful score and be more positive than a weak smile.
Formula scores
The video data of facial expressions were compiled by 1) a method of engagement involving the amount of emoting in terms of the percentage of people emoting and the volume of emoting; 2) a measure of a specific subset of the seven core emotions and the amount of reaction generated according to each; 3) a second method of engagement, related to temporal pace and frequency; and 4) a study of which emotions were felt, as a measure of valence, during the branded moments of the TV spots.
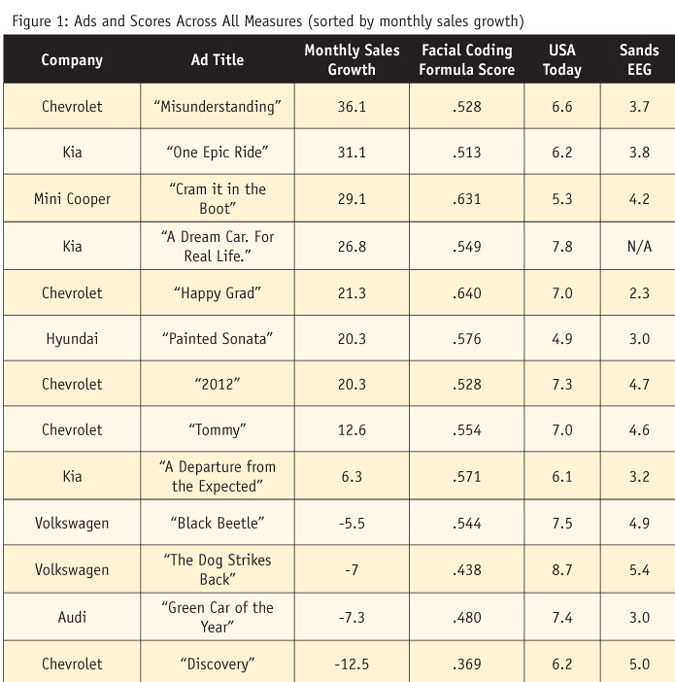
Each of the four elements has specific scoring ranges that were normalized to make each element have a minimum value of 0 and a maximum value of 1. Those moments consisted of when the voice-over cited the branded offer by name, when the car with its branded logo was clearly visible or in those cases where the car’s design (think of both the Mini and the VW Beetle) is so distinct as to serve as a brand signifier. A formula involving those four measures, with a weighted degree of each, totaling 100 percent, led to the specific results in rank order of performance from January-February 2010-2012 sales growth shown in Figure 1.

The table summarizes the data regarding the relative rankings that USA Today readers and EEG-tested participants gave to nearly all of the 13 Super Bowl TV spots under review. The data for both methodologies produced a sufficient amount of variation, with Ad Meter scores ranging from 4.94 to 7.75 and EEG scores ranging from 2.3 to 5.4 (with the top-end EEG score possible in the Sands methodology not known).
Figure 1 shows that the rank-ordering of ads in terms of monthly sales growth of their products following the Super Bowl more closely conforms to the predictions of the facial-coding formula than to USA Today polls or Sands Research data, especially in predicting negative sales growth. This is perhaps a reflection of the difference between “good” reasons and “real” reasons for buying products.
This model looking at the impact of formula score on monthly sales growth had an R2 of .404, showing a greater degree of explanatory power than other models. Finally, by facially-coding the participants while they gave their verbalized rankings for 10 of the 13 TV spots in this study, an additional advertising/sales relationship result emerged. Here, two emotions were enough to produce substantially higher correlations as follows: R2 = .69 when positive emotions were taken into account and R2 = .43 when negative emotions were taken into account.
An accurate reading
In this study, we have shown that a method for analyzing consumers’ facial expressions proves to be a stronger predictor of sales than survey-based and other emotion-based measures. Facial coding appears to be a methodology which can be of great value to marketers who are interested in getting an accurate reading of consumers’ emotions. This measure has value not only in the advertising context of this article but in analyzing consumers’ reactions to new products, their experiences in service settings and a variety of other applications.