
••• shopper insights
Nielsen data finds grocery growth pockets
More trips, more opportunities
 Despite overall bleak headlines about retail’s slowdown in the last year, there are still some pockets of growth happening across the U.S. grocery retail landscape, according to findings from Nielsen studies. To understand where these pockets exist, retailers must first understand the dynamics of consumers’ shifting shopping habits in recent years across channels.
For the first time in over a decade, shoppers actually made more trips to stores, taking an average of 109 trips per household in 2016. However, despite this increase in trips, overall spending was flat, as 85 percent of those additional trips had smaller basket sizes (less than 15 items per trip) compared to the year prior. More frequent trips with smaller basket sizes leads to less worth in dollar sales for retailers.
One channel worth focusing on is deep discounters that offer value and heavy discounts (not including dollar stores). For many retailers, but particularly deep-discount retailers, store brands (also referred to as private label) play a strategic role for winning over shoppers from other channels. Compared to other major retail channels, deep discounters have more than twice the store-brand share of dollars.
While consumers are taking more trips across most retail channels, deep-discount grocery is seeing some of the largest increases in shopper activity. In fact, while trips across all channels are up 0.5 percent, shoppers took 2.8 percent more trips to deep discounters over the last year. However, only about 40 percent of households shop at deep discounters, which is much lower compared to more established channels like supermarkets and mass merchandisers. For deep discounters, there are still significant opportunities for growth ahead, unlike the already-saturated conventional grocery channel.
What’s more, deep-discount grocery and online channels were among the top-growing beneficiaries of consumer spend leakage from mass merchandisers. With online grocery sales anticipated to reach $100 billion by 2025, e-commerce will continue to siphon off sales from other channels. Part of the reason consumers are going online is because they’re seeing value, spending more per trip on store-brand purchases made online ($17 average) compared to the total average basket spend on store brands across all channels ($12 average).
When it comes to deep-discount grocery chains, store brands comprise a majority share of sales in three departments: dairy (72 percent), grocery (52 percent) and frozen food (53 percent). This is driven by both penetration and trips, with consumers making more trips to purchase store-brand grocery, dairy and frozen products (up 3.3 percent, 5.7 percent and 3.7 percent in trips, respectively, compared to the prior year) than trips made for branded products from these departments.
Deep-discount grocery retailers are certainly reaping the benefits of having a robust store-brand presence within their stores. With consumers taking three times more trips including store-brand purchases to deep-discount grocery stores compared to other channels, like mass merchandise or dollar stores, opportunity for growth should only continue to rise.
While deep discounters have significantly high store-brand growth, there is still room for penetration growth across all retail channels. Whether a deep discounter, a traditional supermarket or an online channel, retailers should continue to keep store-brand strategy front and center as a way to offer consumers the value and quality they’re looking for at price points that resonate with their wallets.
Insights from this article were derived from: Nielsen Homescan, Total U.S., 52 weeks ended April 29, 2017 (UPC-coded items); Nielsen Answers Panel, 12 weeks ended Jan. 28, 2017.
••• automotive research
AAA studies cost of car ownership
$8,500 for average new vehicle
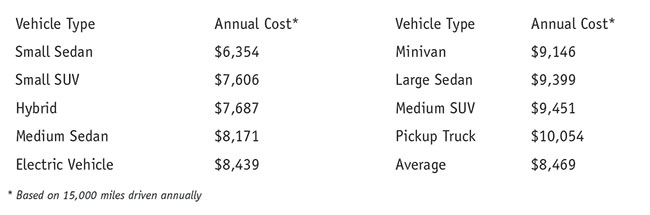
 Owning and operating a new vehicle in 2017 will cost a driver an average of $8,469 annually, or $706 each month, according to a new study from AAA. The annual evaluation of driving costs reveals that small sedans are the least-expensive vehicles to drive at $6,354 annually, however small SUVs ($7,606), hybrids ($7,687) and electric vehicles ($8,439) all offer lower-than-average driving costs to U.S. drivers. Conversely, of the nine categories included in the evaluation, pickup trucks are the most expensive vehicles to drive at $10,054 annually.
In addition to analyzing the ownership costs for sedans, SUVs and minivans, AAA’s Your Driving Costs study added four new vehicle segments in 2017 – small SUVs, pickup trucks, hybrids and electric vehicles.
To estimate the overall cost to own and operate a new vehicle, AAA evaluated 45 2017 model-year vehicles across nine categories and focused on mid-range, top-selling vehicles. AAA’s annual driving cost is based on a sales-weighted average of the individual costs for all of the vehicle types. Key findings include:
Depreciation – the declining value of a vehicle over time – is the biggest, and most often overlooked, expense associated with purchasing a new car. New vehicles lose an average of $15,000 in value during the first five years of ownership. In 2017, small sedans ($2,114) and small SUVs ($2,840) have the lowest annual depreciation costs, while minivans ($3,839) and electric vehicles ($5,704) are at the high end of the scale.
To calculate annual maintenance and repair costs, AAA examined factory-recommended maintenance, replacement tires, extended warranty costs and services associated with typical wear and tear. New vehicles, on average, will cost a driver $1,186 per year to maintain and repair.
The inevitable costs associated with maintenance and repair should be an important consideration for car shoppers, as a recent AAA survey found that one-third of U.S. drivers could not afford an unexpected repair bill.
Fuel costs vary significantly by vehicle type, ranging from 3.68 cents per mile (electric vehicles) to 13.88 cents per mile (pickup trucks). New vehicle owners, on average, will spend just over 10 cents per mile – about $1,500 annually – to fuel their vehicles.
New to the Your Driving Costs study in 2017, AAA found that electric vehicles have lower-than-average driving costs at $8,439 per year. Without a gasoline engine to maintain, electric vehicles have the lowest annual maintenance and repair costs, at $982 per year. By relying on electricity instead of gasoline, fuel costs are also significantly lower than average, at under 4 cents per mile. Depreciation, however, is currently extremely high for these vehicles, losing an average of nearly $6,000 in value every year. A recent AAA survey revealed that one in six Americans is likely to choose an electric vehicle, the majority motivated by their lower long-term ownership costs.
••• media research
Podcast audience small but influential
Group tends to be young, educated, successful
 Nearly one in 10 U.S. adults downloaded or listened to a podcast in the last 30 days – a young, well-educated and highly successful audience that relies on both digital and traditional media, according to researcher GfK MRI.
Compared to the general U.S. population (ages 18+), recent podcast users are engaged with their phones as sources of entertainment. They also rank high when it comes to their ability to influence other people, according to the most recent data (September 2016 to May 2017) from GfK MRI’s Survey of the American Consumer.
Approximately 8.6 percent of U.S. adults – roughly 21 million people – downloaded or listened to a podcast in the last 30 days, up from 7 percent a year ago. Among podcast users, 53 percent were college graduates, 45 percent held managerial/professional jobs and 45 percent were between the ages of 18 and 34 – proportions well above the general population figures.
While the podcast group is very active on the Internet, they are also big readers of print magazines, with 22 percent placing in the heaviest reading quintile (slightly higher than the U.S. average). Some 68 percent had visited a magazine Web site – and 69 percent a newspaper Web site or the electronic version of a newspaper – in the last 30 days.
Seven in ten (70 percent) podcast users consider their mobile phones as sources of entertainment and about 36 percent would be willing to receive ads on their phones in exchange for lower monthly costs. In addition, 68 percent are interested in watching video clips on their mobile phones and 21 percent say they would be willing to pay a monthly fee to watch live TV on them. (Note: Data in this paragraph come from the Fall 2016 GfK MRI release, covering September 2015 to November 2016.)
News Web sites are popular destinations for podcast users – including nytimes.com (visited by 32 percent of users), huffingtonpost.com (32 percent), wsj.com (22 percent) and bbc.com (20 percent). GfK MRI also found that 20 percent of podcast users are “Influentials,” meaning that they engaged in three or more of 11 public activities, from making a speech to running for political office. This is three times the incidence of Influentials in the total adult population (7 percent).
GfK MRI’s data shows that more than one in 10 (11 percent) podcast users is an active member of a group that tries to influence public policy or government; that is triple the proportion (3.7 percent) in the general population. Eighteen percent (18 percent) say they have attended a political rally, speech or protest – making them 163 percent more likely than all adults (7 percent); and 24 percent have contacted a politician at the state, local or national level, versus 10 percent among all respondents.
••• financial services
Keeping up with the digital natives
Highlights from BOA’s consumer mobility report
 Digital natives’ obsession with technology is set to change the world as we know it. A recent survey finds they are so concerned with their digital footprint, the majority (54 percent) of Millennials and Generation Z (ages 13-17) are Googling themselves regularly, with 10 percent self-searching on a daily basis.
Furthermore, Gen Zers would give up daily “must-haves” to remain connected to their mobile device for the day, including television (80 percent), tablets (78 percent) and gaming systems (64 percent). Nearly one-third would even give up their friends or money (28 percent).
These findings are from the latest Bank of America Trends in Consumer Mobility Report, which explores timely mobile trends and forward-looking consumer behaviors that increasingly impact our everyday lives. For the first time, the survey includes today’s youngest generation – Generation Z – to better understand the future of mobile and the next era of banking.
One of the most visible differences today is the way we communicate, as Gen Zers appear to live by the mantra, “If you can’t say it in 140 characters or less, don’t say it at all.” According to the survey, Generation Z is significantly more likely than their older counterparts to use emojis (95 percent, compared to 79 percent), social media (88 percent, compared to 77 percent), acronyms (87 percent, compared to 69 percent) and even selfies (81 percent, compared to 45 percent) to converse with others.
These changing communications and social norms also appear to influence the way parents interact with these digital natives. While 48 percent of parents say mobile has a positive impact on their family life, many parents are instituting digital boundaries in the household, with a ban on texting and driving (66 percent), mobile phones at the dinner table (52 percent), and e-mailing or texting during a conversation (43 percent) as the most popular.
What’s more, almost all parents say they keep an eye on their children’s technology use, with nearly half monitoring everything and keeping tabs on their passcodes, and only 5 percent completely respecting their privacy.
While younger generations are also leading the charge as it relates to mobile finances, with three-quarters of Millennials using a mobile banking app, adoption is strong across all generations. Two-thirds of Gen Xers use the app, followed by 47 percent of Baby Boomers and 40 percent of seniors.
Millennials are the most likely generation to turn to the app during key life events, including saving for college (45 percent, compared to 29 percent), planning for retirement (35 percent, compared to 28 percent) and buying a home (34 percent, compared to 24 percent).
Overall, 62 percent of Americans use their bank’s mobile app, up from 54 percent in 2016. Of users, more than four in five access their mobile banking app at least once a week, with 29 percent checking their app daily.
Other highlights from the report include:
Reconnecting with retro: 76 percent of consumers say they use a retro device, including CDs (49 percent), landlines (36 percent) and VCRs (17 percent).
Digital detox: 46 percent of adults are supportive of digital detoxes – intentionally disconnecting for more than 24 hours – with 11 percent reporting they’ve previously done one.
Age of information: Americans are increasingly turning to mobile as their go-to news source, with many learning about the following prominent events through digital channels.
Sharing it all: Many consumers want their mobile device to track their daily activity, with Millennials the most comfortable storing their personal (93 percent, compared to 82 percent) and financial (84 percent, compared to 63 percent) information.
Convergys, an independent marketing research company, conducted a nationally representative online survey on behalf of Bank of America May 25-June 3, 2017 using a panel-provided sample. Convergys surveyed 1,000 respondents throughout the U.S., comprised of adults ages 18+ with a current banking relationship (checking or savings), and who own a smartphone. In addition, 201 panelists were surveyed in the 13-to-17-year-old age group who also own a smartphone. The margin of error for the national sample of n=1,000 is +/- 3.1 percent, and the margin of error for the 13-to-17-year-old sample where n=201 is +/- 6.9 percent, with each reported at a 95 percent confidence level.