
Hitting the peak of pique
Editor's note: Charles Young is CEO of Ameritest.
Attention and memory are the alpha and the omega of advertising effectiveness, just as rhythm and melody are essential for anyone trying to pen a memorable pop song. To connect attention-getting advertising to action, such as consumer purchasing behavior, it is necessary for advertising to work through memory.
Short-term or working memory, which integrates all the perceptions of the advertising experience streaming to the brain – pictures, words and music – does its job typically in less than 30 seconds, before passing the ball to long-term memory.
For advertisers who debate the short-term versus long-term effects of advertising, it is important to understand that memory plays a role in all types of effective communication. Performance advertising, focused on short-term sales effects, works by activating existing memories left behind by past marketing activities, while brand-building advertising does its job by adding new memories to the brand’s memory bank account, which then can pay dividends over months or years.
In the current “attention economy,” therefore, it is important to understand how attention is connected to memory in a piece of communication.
To study long-term brand memories, Ameritest ran a follow-up experiment with 36 fast-food commercials that we had tested a year earlier. In this experiment we used two very different approaches to our diagnostic measurement: the Picture Sorts technique used in our standard pretest, and EEG measurement, using brain wave equipment developed by Steve Sands of the University of El Paso.
What we discovered is that the two measurement approaches are uncorrelated but complementary in providing insights into the communication problem. That is, the two measurement approaches are measuring two different psychological variables that are both involved in determining advertising effectiveness.
Both approaches did agree that commercials that do an above average job of breaking though media clutter to attract viewer attention are characterized by a greater number of peak moments of experience. But as we will see, a “peak moment” means something different with each measurement approach.
For the 20 high-attention ads in our test sample, brain waves peaked an average of 3.7 times versus only 2.3 times for the 16 low-attention ads. Similarly, when we looked at the picture-sort data for the Flow of Attention we found 4.6 peaks for high-attention ads versus 3.4 peaks for low-attention ads. So, not surprisingly, we concluded from both approaches that the rate at which a TV commercial produces memorable moments of experience is predictive of engagement overall.
What was interesting was that when we compared the two sets of time-series data, ad by ad, we discovered that brain waves and picture sorts of memory don’t often peak on the same moments.
Altogether, the 36 commercials generated 113 brain wave peaks and 149 picture-sort peaks but only 61 peaks were common to both measurement systems.
Double peaks, or moments that are peaks in both the brain wave and picture-sort data, are by far the most strongly predictive of the overall attention score for an ad. They occur four times as often in high-attention ads as in low-attention ones.
Hardest-working parts
The convergence of the two measurement systems, therefore, can help advertisers identify the hardest-working parts of an ad. Content analysis revealed that double peaks were most likely to contain the following:
- relevant news, such as the announcement of a price promotion;
- inciting incidents, typically involving a moment strongly charged with negative emotion to set up a joke or storyline;
- surprising moments or turning points in stories;
- climactic moments or punchlines for jokes.
In other words, double peaks can be used to identify the most dramatic highlights of an ad from an audience’s point of view. If we were talking about movies instead of TV commercials, these would be the scenes that would most likely make it into the movie trailer.
What about the peak moments that one diagnostic technique identifies but the other does not? One part of the answer is quite simple. With brain waves, we are measuring audience response to the total multi-sensory experience – the pictures plus the words plus the music – while the picture sorts focus only on the visual part of the commercial. (We use a similar technique called Copy Sorts to probe the verbal communication.) So, in some instances brain waves peak at a moment in an ad identified with a strong line of copy but not necessarily a strong visual.
In short, while brain waves measure the total multi-sensory experience in real time as a video is being watched, picture- and copy-sorting memory-recognition-based techniques can be used after the fact to peel back the different layers of the advertising experience.
Activate the senses
However, this is not the whole story. When we analyzed the content of the peak experiences in these ads, it turned out that there were nearly the same number of peaks for the “story” part of the ad, while the picture sort that measures selective attention – the Flow of Attention – produced more than twice as many peaks as the EEG measurement did in the “product” part of the ad, particularly product images that would activate our basic senses such as taste, touch and smell.
Our hypothesis for this finding is that these images tap into the deepest part of the brain – the “reptilian” brain or amygdala – which is where our primitive drives such as hunger or sex originate. Because these parts are deep in the center of the brain, they’re harder to read with EEG machines that only pick up electrical activity closer to the surface of the brain.
But the most intriguing finding in this experiment was one that may help explain the rhythmic structure of visual communication with motion pictures.
As we analyzed these ads scene by scene, we observed that the brain wave pattern would sometimes peak at the beginning of a scene, where it was unclear what was about to happen. This would correspond to a low spot in the Flow of Attention. Then the brain wave arousal would fade at the end of a scene, just as the Flow of Attention was peaking. As a result, in some storytelling parts of the ad, the brain wave curve and the memory curve would be moving in opposite directions.
This makes sense if we consider the difference between these two measurement techniques. Brain wave EEG machines measure the amount of energy being produced by the brain moment by moment in real time, as a viewer watches a video.
But unlike brain-wave measures, picture-sort data is collected after the fact, typically several minutes after the forced viewing of the ad in a test. By this time the images from an ad have already been sorted by the brain and encoded into memory.
The first of the three picture sorts that we use in a pretest, the Flow of Attention, is a measure of the selective attention of an audience that is, in fact, the most predictive diagnostic for the attention score for a digital or TV ad. The second and third picture sorts – the Flow of Emotion and the Flow of Meaning – are, on the other hand, the most predictive diagnostics for the motivation score of an ad – the link to action or future purchasing behavior.
Memory researchers have established that what the brain remembers is its interpretation of the meaning of what just happened in an experience. And the emotional response generated by an experience is a key predictor of long-term memory formation.
With that in mind, we now have a new insight into how long-term brand memories may be formed. This is how the perceptual process works from a storytelling perspective: stories begin with moments or scenes that arouse our curiosity. In response, the brain releases energy to alert the mind to new information – “Pay attention here! Something new is about to happen!”
As a result, brain waves peak as neurons fire away. But as a scene unfolds into something emotionally meaningful, only the important information is sorted into memory. With that resolution, the brain returns to a state of rest and neuronal activity quiets down.
In the context of advertising, it would be these emotionally meaningful visuals that comprise the set of images encoded into long-term memory that we would expect to be most strongly associated with the brand image.
Of course, brain waves may also peak on the resolution of a scene. Because a film or video is designed to be a chain of meaningful moments, the resolution of one scene may be the beginning of another as audience engagement is ratcheted up with the build in involvement from the beginning to the end of the story.
But in general, this back and forth between curiosity and meaningful resolution is what helps to give rise to the rhythms of visual storytelling.
Memory hierarchy
One of the other things that academic researchers have learned about memory is that there is a hierarchy to how our memories are stored. Not all of our memories are created equal. Our brains don’t store all the information about an experience but only the essential parts – the gist of it, just enough so that we can reconstruct the original experience when we remember it.
An easy way to think about this is to use the analogy of the long-running game show Wheel of Fortune. In the game contestants try to figure out a word or phrase by a few letters – thus eliminating redundancy. If you’re lucky enough to guess a few essential letters right off, you can quickly guess the whole word. But if you pick the wrong letters at first, it takes longer to guess the word.
One trick to understanding how a brand-building commercial or web video might be stored in consumer memory is to identify a minimal set of images that could be used to describe a whole ad – as in the original storyboard.
Figure 1 shows how data can be used to identify the minimal image set from a high-performing Wendy’s ad that we tested.
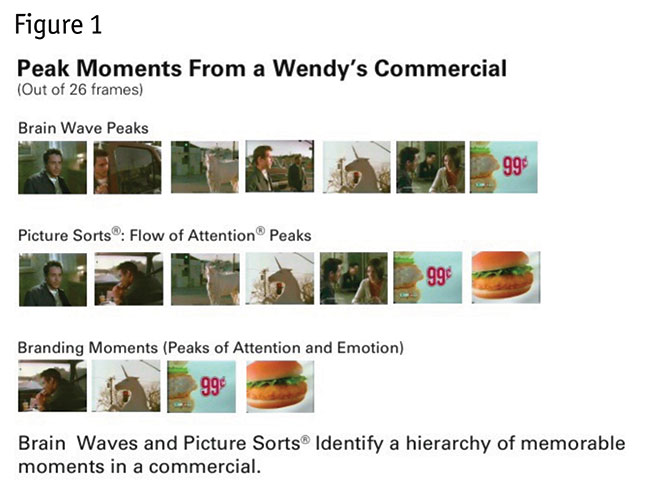
Altogether we needed 26 perceptually distinct images to describe the total visual information content of this 30-second commercial. But by using brain wave peaks, this set can be reduced to the seven images shown in the first row.
The commercial is about a man telling his girlfriend that he was late coming home because he and a friend saw a unicorn on the street. The girlfriend was not moved by this tall tale but was surprised by an offhand remark he makes about a 99-cent chicken sandwich on sale at Wendy’s.
If we look at the seven peak frames in the next row, identified by the Flow of Attention, we get a slight variation on the story. Now we learn that the man was actually eating the chicken sandwich when he saw the unicorn. But two other images are gone – shots that provide the setup for the central unicorn visuals – and instead we see an additional image of a tasty chicken sandwich to add appetite appeal to the rational 99-cent price message.
Finally, we can identify an even smaller set of four images that score high on both the Flow of Attention and the Flow of Emotion combined – what we call the brand-building moments of the ad.
These are, by definition, images that consumers 1) focused their attention on and 2) that are highly charged with self-reported emotion. According to these four visuals, the gist of this effective creative idea is that the offer of 99 cents for these chicken sandwiches at Wendy’s is as rare as a unicorn.
Any of these small sets of images might be enough to win an advertising version of Wheel of Fortune. But which comes closest to describing how these images might actually be stored in the hierarchy of long-term memory? To answer this question, in our follow-up experiment to our original ad tests we interviewed 200 consumers about a year after all the ads had aired in-market. We showed consumers a large number of images taken from the commercials, in randomized order. After showing each image we asked two questions: did they remember ever seeing it on TV and which brand was it for.
The results are shown in Figure 2. The chart demonstrates two things. First, the set of images that had, by far, the most memorable performance over the long term were those that captured both high attention and generated a high (self-reported) emotion – the small subset of images in an ad that work the hardest to build a brand.
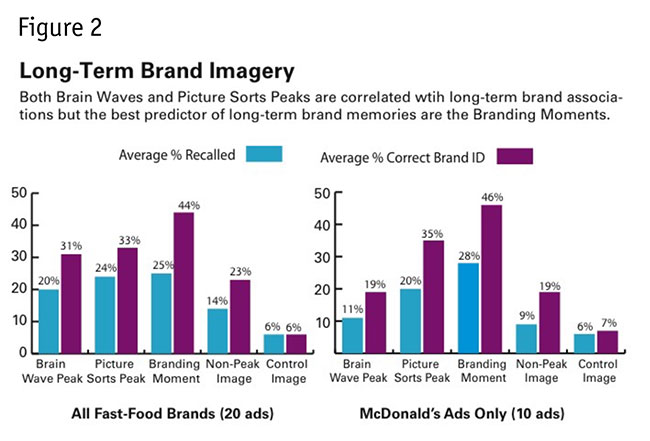
Second, advertising images are indeed stored in memory in a hierarchy – not all the images from a given ad are remembered equally well. Some images in an ad are more memorable than others.
Finally, by using the complementary diagnostics of brain wave measurement and picture-sorting memory probes in the same experiment, we’ve gained a new insight into how advertising works. The rhythmic structure of visual storytelling is important for understanding the how that hierarchy is constructed.
Rhythm is key
Watching ads and listening to a piece of music have a lot more in common perceptually than we realize. Rhythm is key to both forms of communication – and key to building a vibrant brand. By paying attention to the emotional highs and lows of an ad, and charting their impact on the viewer’s experience, you can understand how to tell your brand’s story in the most effective – and memorable – way possible.