
Understanding relative importance weights
Editor's note: Michael Lieberman is the founder and president of Multivariate Solutions, a New York-based research consulting firm. He can be reached at michael@mvsolution.com.
I like to say that there is nothing new under the sun statistically speaking. Almost all the math in common multivariate analyses were proven more than a century ago. Most new products are a mélange of existing techniques with a simple twist.
Every so often, however, a new technique emerges that leverages prevalent methodologies with growing bandwidth of personal and cloud computing. In this piece I will introduce importance weighting, a useful technique in marketing that allows marketers to assign varying levels of importance or priority to different factors or elements within their marketing strategies. I will outline one that is gaining popularity in the marketing research world – Johnson’s relative weights analysis.
In 2000, Jeff Johnson wrote a technical paper introducing relative importance weights. Prior to that, researchers relied on traditional statistics (e.g., correlations, standardized regression weights) that are known to yield affected information concerning variable importance – especially when predictor variables are highly correlated with one another. In the context of market research, relative weights refer to the importance or influence of different attributes or factors on consumer preferences or purchasing decisions. Common uses for relative weights are:
- Target audience segmentation.
- Marketing mix models.
- Advertising campaigns.
- Content marketing.
- Customer journey-mapping.
- Product line optimization.
- Brand equity measurement.
In Johnson’s relative weights analysis, the focus is on determining the relative impact of each variable on the dependent variable, taking into account the influence of other variables in the model. The relative weights of the variables are calculated based on their unique contribution to the outcome variable while considering the presence of other variables in the model.
The Johnson method utilizes not only standardized outcomes from regression analysis, but also correlations between the dependent and predictor variables, as well as eigenvector analysis (a linear algebra matrix method) into a more nuanced nine-step technique.
Ease of relative weighting
Johnson’s relative weighting can get granular with a large number of variables. By contrast, linear regression cannot easily handle, say, 20 variables. Differences between highly correlated variables would blur the outcome.
This is not the case with relative importance weights. Moreover, given the ease of programming, one can run the analysis across many dependent variables simply by changing one or two lines in R stat code. Using R or Python and calculating the relative importance weights has turned a multistep process into a few lines of code. The three lines of R stat code (below) reads in data and performs a relative weight analysis on a dependent variable and, in this case, nine predictor variables.
# Load the 'AvWeight' dataset
data(AvWeight)
# Fit a linear regression model
model <- lm(depend ~ ., data = AvWeight)
# Perform the relative weights analysis
rel_weights <- calc.relimp(model, type = "lmg")
The three lines, with slight changes of dependent variable in the code, produce Table 1, yielding a well-rounded and easy-to-replicate brand picture across nine attributes and six dependent variables. Darker shades of gray indicate a stronger relative weight.
Table 1 shows the output for our software client, ByteSmith Technologies.
Table 1
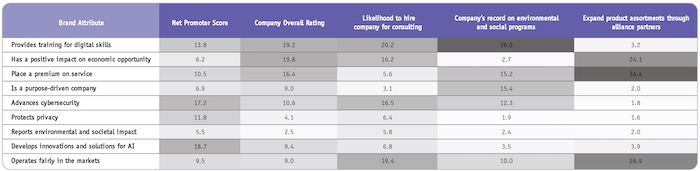
Here are salient points I would report to ByteSmith at first glance:
- Net Promotor Score, overall company rating and consulting likelihood have no dominant drivers among the attributes.
- ByteSmith’s record on environmental programs is driven by “provides training for digital skills.” This could be a key finding for the company. A media campaign highlighting ByteSmith’s free community training may be preferable to a major cash donation to an environmental cause.
- “Expand product assortments through alliance partners,” which is a key variable as ByteSmith provides distribution of its computer services through partnership agreements, is driven by two attributes, “has a positive impact on economic opportunity” and “place a premium on service.”
Understanding relative weights in market research can assist businesses in product development, pricing strategies and marketing campaigns. It helps them identify key drivers of consumer preferences, prioritize product features and allocate resources effectively to meet customer demands.
Applying Johnson's relative weight analysis – Kano quadrant analysis
Let’s explore another example. Bourdain’s Barbecue wants to conduct a customer satisfaction survey to quantify customer loyalty and ascertain its market position vis-à-vis the increasingly competitive casual dining segment. In addition, they request that we conduct a Kano analysis to assess what sets them apart.
Kano analysis is, in essence, a measure of importance of the features to the customer and performance of the business. Often a standard importance question is asked in addition to performance ratings and a dependent variable, such as overall satisfaction or purchase intent. The top of the scale, whether 5, 7 or 10, is “very important,” and the bottom value is “not at all important.”
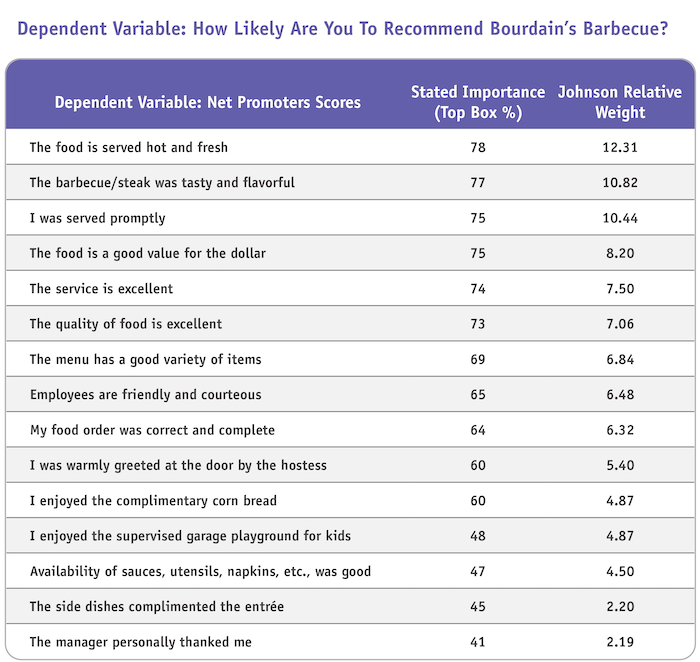
Kano's initial procedure is to determine inferred importance by testing the effect of variable performance measurements against a dependent variable. Here we are deploying Johnson’s relative weight analysis in place of standard importance regression analysis.
Alongside the relative importance weights score is the mean stated importance (Figure 1). These are the axes upon which a Kano analysis rests.
Figure 1
When graphed, with relative importance weights and stated importance centered and normalized, a Kano visual illustrates more clearly the Kano quadrants and how Bourdain’s Barbecue is perceived by its patrons.
Figure 2
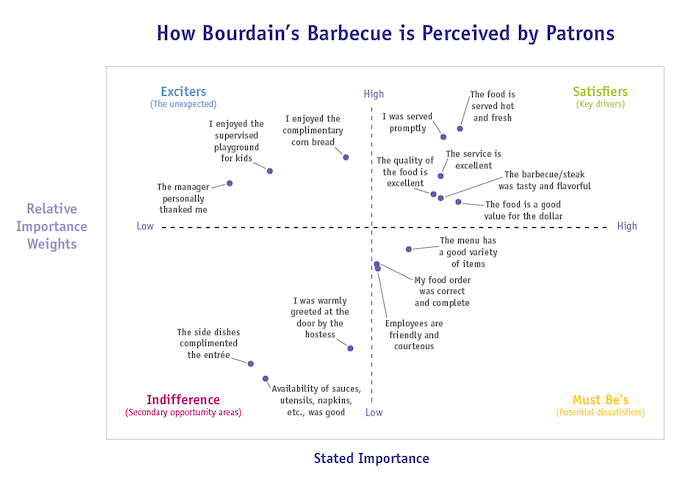
Of course, many of the expected restaurant drivers do, in fact, place in the satisfiers key drivers’ quadrant in the upper right-hand corner – good food, fast service and good value for the money. It is the upper left-hand quadrant, though, that provides the most insight for Bourdain’s Barbecue and differentiates it from other casual dining steak establishments.
The Kano process employing Johnson relative weighting shows that three attributes help Bourdain’s Barbecue to stand out – two of them are not intuitive. Most barbecue steak casual dining restaurants do not offer “all you can eat” cornbread. In the competitive, “fill up the tank” culture of American dining, “all you can eat” is a powerful subliminal pleaser. Even though portions at Bourdain’s Barbecue are huge, patrons being able to eat all the cornbread they want is a distinguishing feature.
The second unexpected, distinguishing feature of the study finds that Bourdain’s supervised, themed play areas are a hit – and not just with the kids. In follow-up interviews, Bourdain’s Barbecue learned that parents find the area fun as well, and that they can place their children safely within sight at a supervised fun house. When the food arrives, they saunter over, scoop up the kids, feed them, then place them back in the fun house so that the parents can enjoy the remainder of their meal while the children rumble.
Attribute attrition – maximizing product lines
In our final example, I will mock-up a recent project. A regional supermarket chain, Lion Food Corporation, wants to create a slimmed-down version of its flagship stores, Cub. Lion Food Corporation has asked to perform a Johnson relative weighting with existing company data. The goal is to streamline product line offerings for a new concept, Cub Express. The company has uploaded a small subset of its sales data silo, 30 million records of shopping visits. Each line of the data represents the purchase from one visit to the flagship store.
There are a few key advantages to this kind of study:
- No field costs – Lion Foods has an enormous amount of data.
- Ease of data availability – Lion Foods provides the data in a form that allows the analyst to shape it into an R stat-ready data set.
- Flexibility – The model can be made to fit numerous analytics subsections if Lion Foods wants to regionalize Cub Express’s brand offerings, or if it would like to run multiple models for different products.
The first step is to organize the data set by individual shoppers. Each customer has a member number. Each line of data is one shopping trip, so individual shoppers may have 20-30 entries. We aggregate (summarize in a new data set by multiple visits for a single customer) so each individual has one row of data. We then create the following variables for analysis.
- Average amount spent per visit.
- Average number of visits over a finite period (e.g., six months).
- Bivariate variables listing each of the 24 breakfast cereals (1 = purchased, 0 = not purchased).
The cleaned data set of roughly 1 million customers is then uploaded into a data set to be opened in R stat for this specific analysis. The results are shown below (Table 2).
Table 2
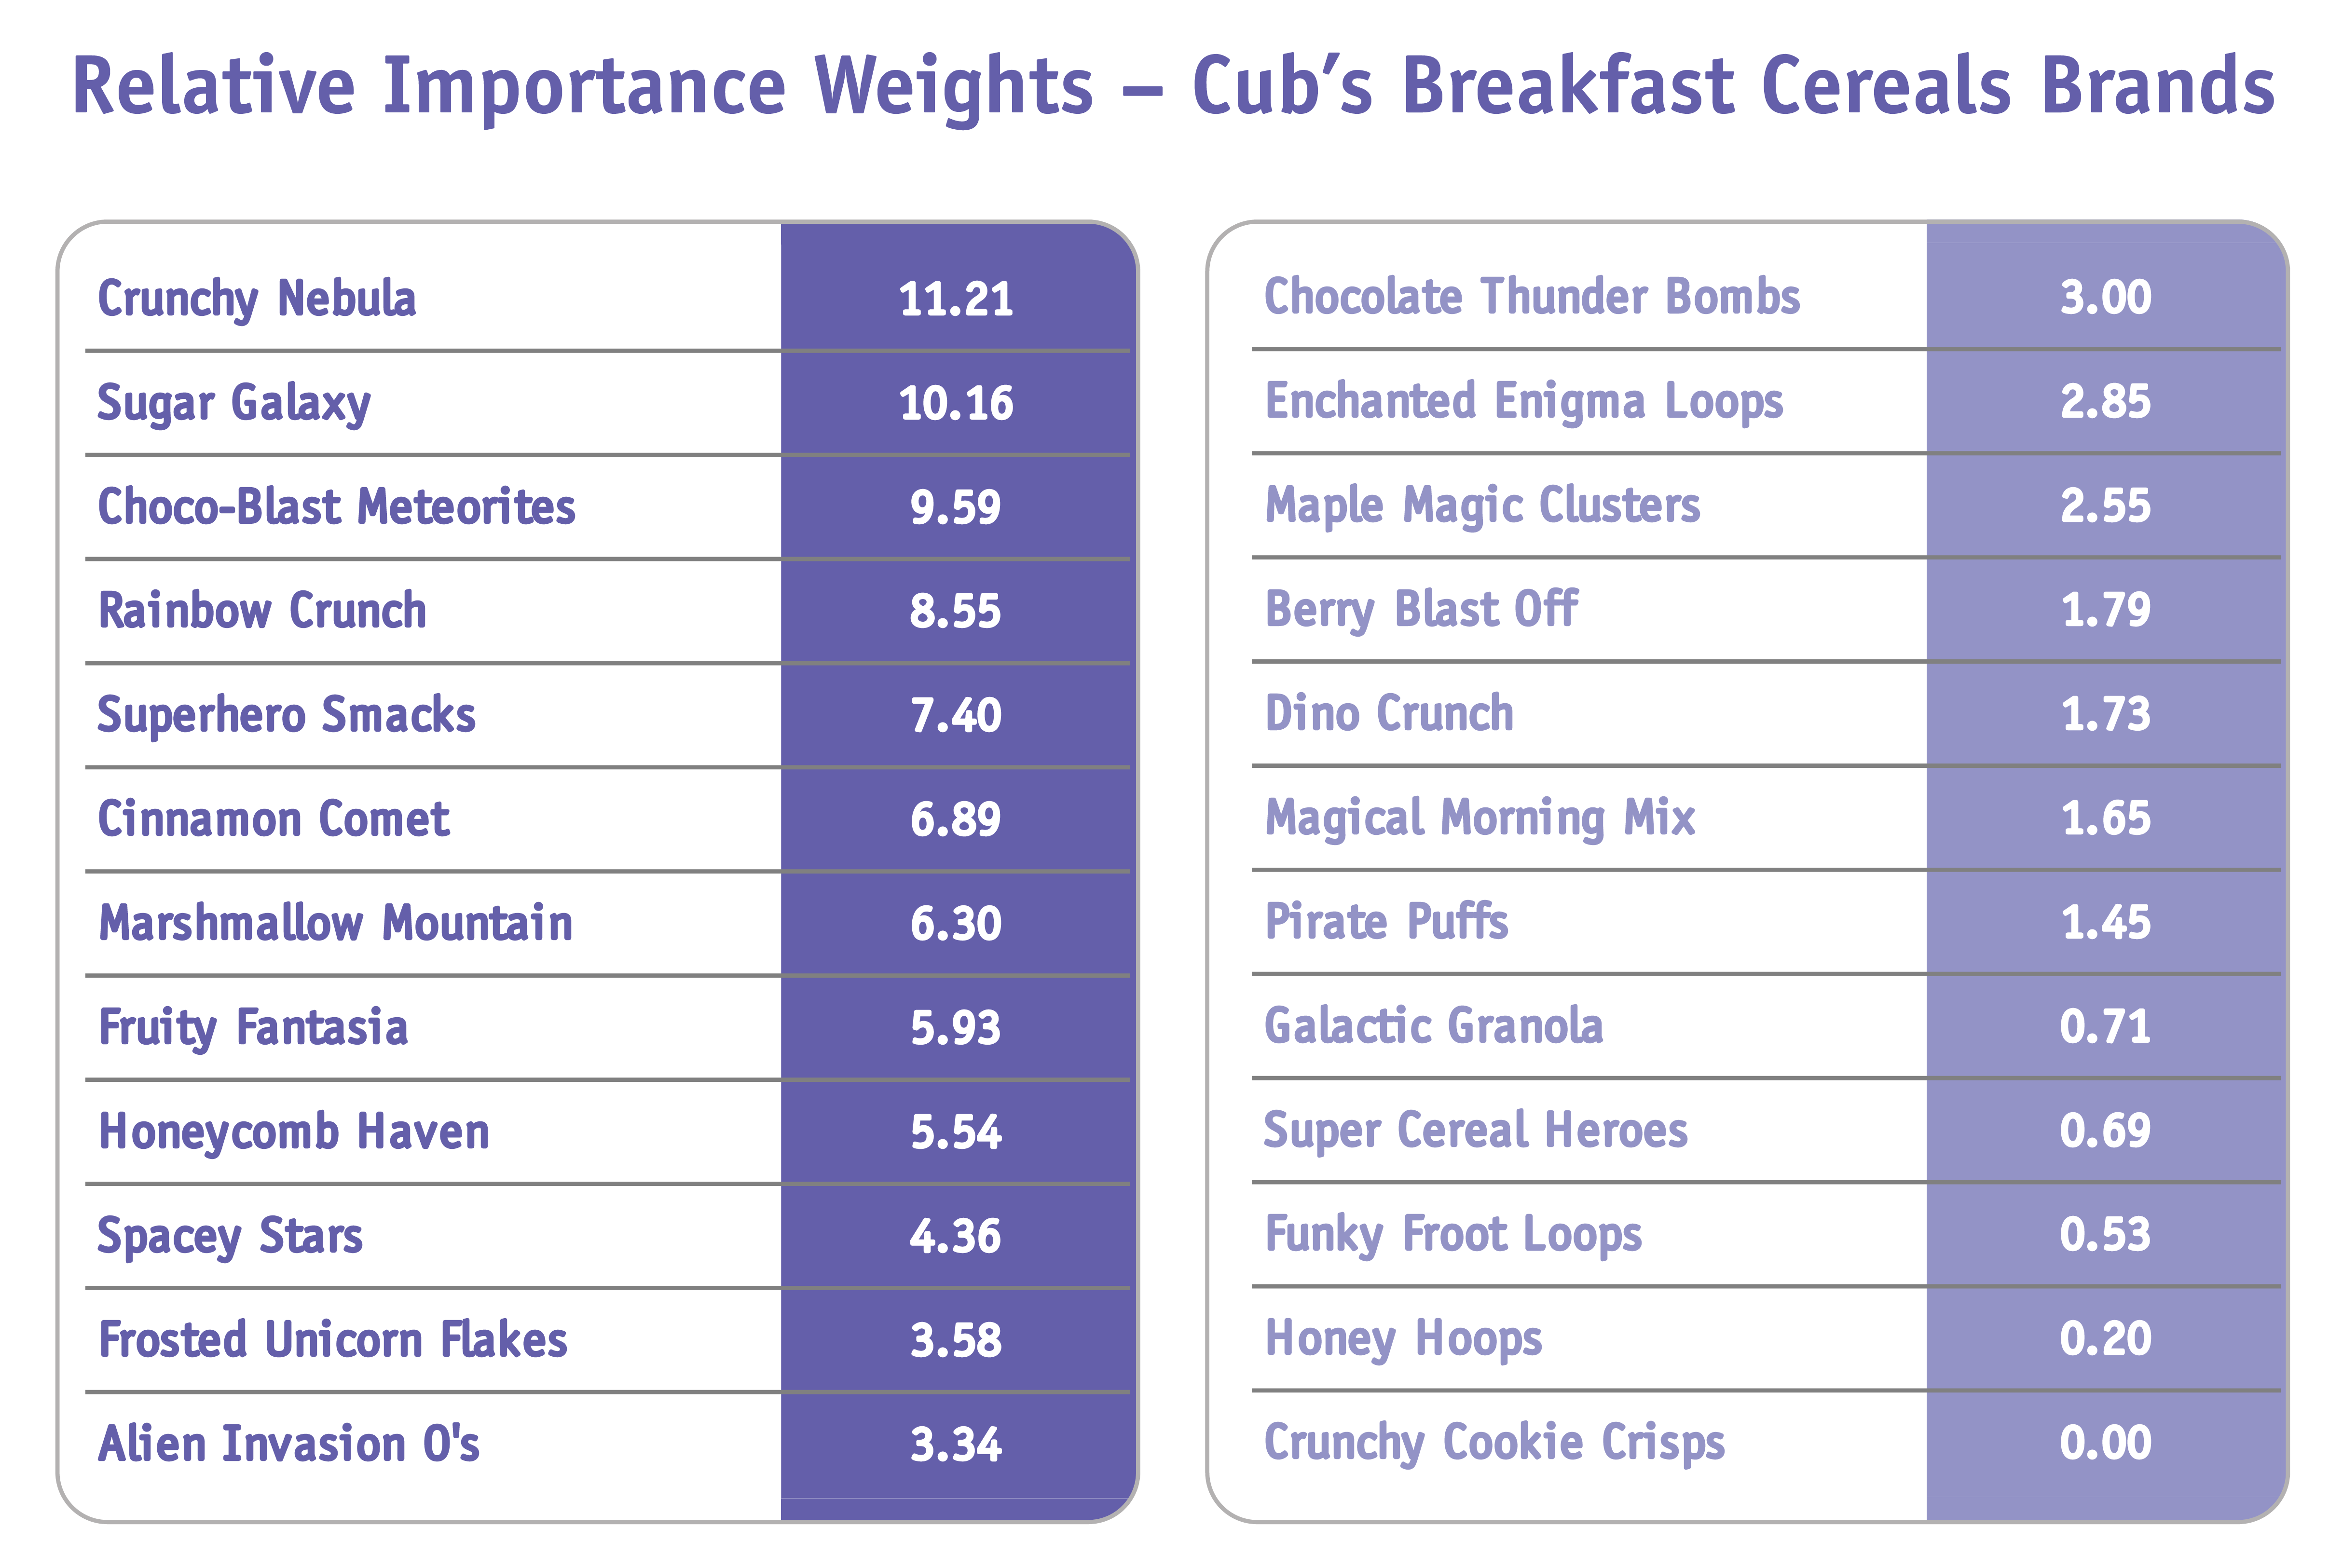
In Table 2, we see the Johnson relative weighting for each of the 24 breakfast cereal brands. Those in dark purple (left) are chosen to be stocked in new Cub Express stores. Those in light purple (right) will not be inventoried.
A more comprehensive approach to data analysis
Johnson's relative weights have revolutionized the field of quantitative analysis and statistical modeling in the marketing research field. With its ability to capture nuanced relationships and incorporate varying importance levels, it offers a more comprehensive and accurate approach to data analysis. As we continue to explore the depths of data-driven insights, these weights serve as a powerful asset, paving the way for more sophisticated and informed decision-making processes.