Each author is employed by YPulse, a New York research firm. Jillian Kramer is vice president of research, MaryLeigh Bliss is vice president of content, Xavier Vivar is vice president of operations, César Ochoa is data analyst and Daniel Coates is president.
Young consumers expect companies to innovate in order to come up with new ways to make their lives convenient and effortless. Since we last spoke about aligning the tolerance of Millennials against the time demands of the market research industry in February 2016, the trend toward convenience (and impatience) has grown exponentially – inspiring us to refresh our guidance for those seeking to survey Gen Z and Millennial consumers.
 Since our last article, culture has advanced to a point that young consumers don’t just want time savings, they expect them. They are less likely to agree that “there is never enough time in the day” as a direct result of using convenient solutions that carve out extra time in their schedules, from food delivery to banking apps. However, we can see by how much more likely they are to become frustrated, and those that fail to meet their expectations will fall out of favor fast with young consumers.
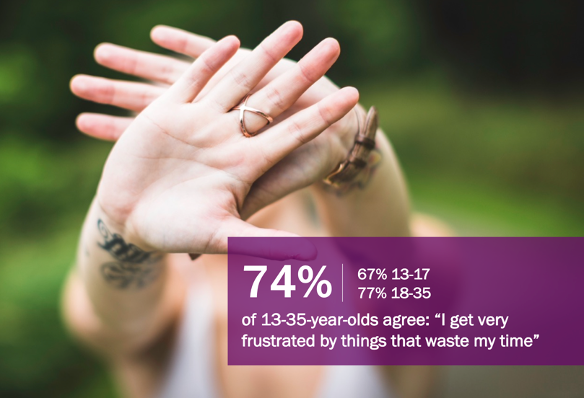
We also see impatience on the rise: 74% of 13-35-year-olds agree with the statement “I get very frustrated by things that waste my time” 48% of 13-to-35-year-olds agree with the statement “I get very frustrated by things that are outdated,” 38% of 13-35-year-olds have cancelled plans because it took too long to get there and 37% of 13-to-35-year-olds agree with the statement, “With all of the technological advances today, I shouldn’t have to do mundane tasks.”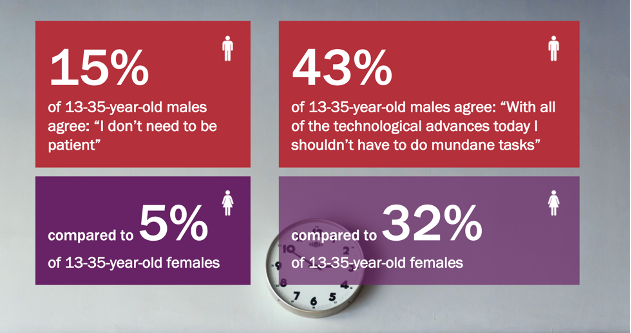
Males are more likely than females to believe that modern advances in technology means patience is no longer required. Many survey researchers struggle to meet quotas for male participation and the secret might well be in the fact that we’re asking more of young male survey participants than they are willing to give.
We compared completion rates with survey duration within our bi-monthly syndicated surveys over the last five and a half years in order to show how quickly we can wear out our welcome with young participants. We use a combination of a proprietary youth panel alongside river sampling vendors.
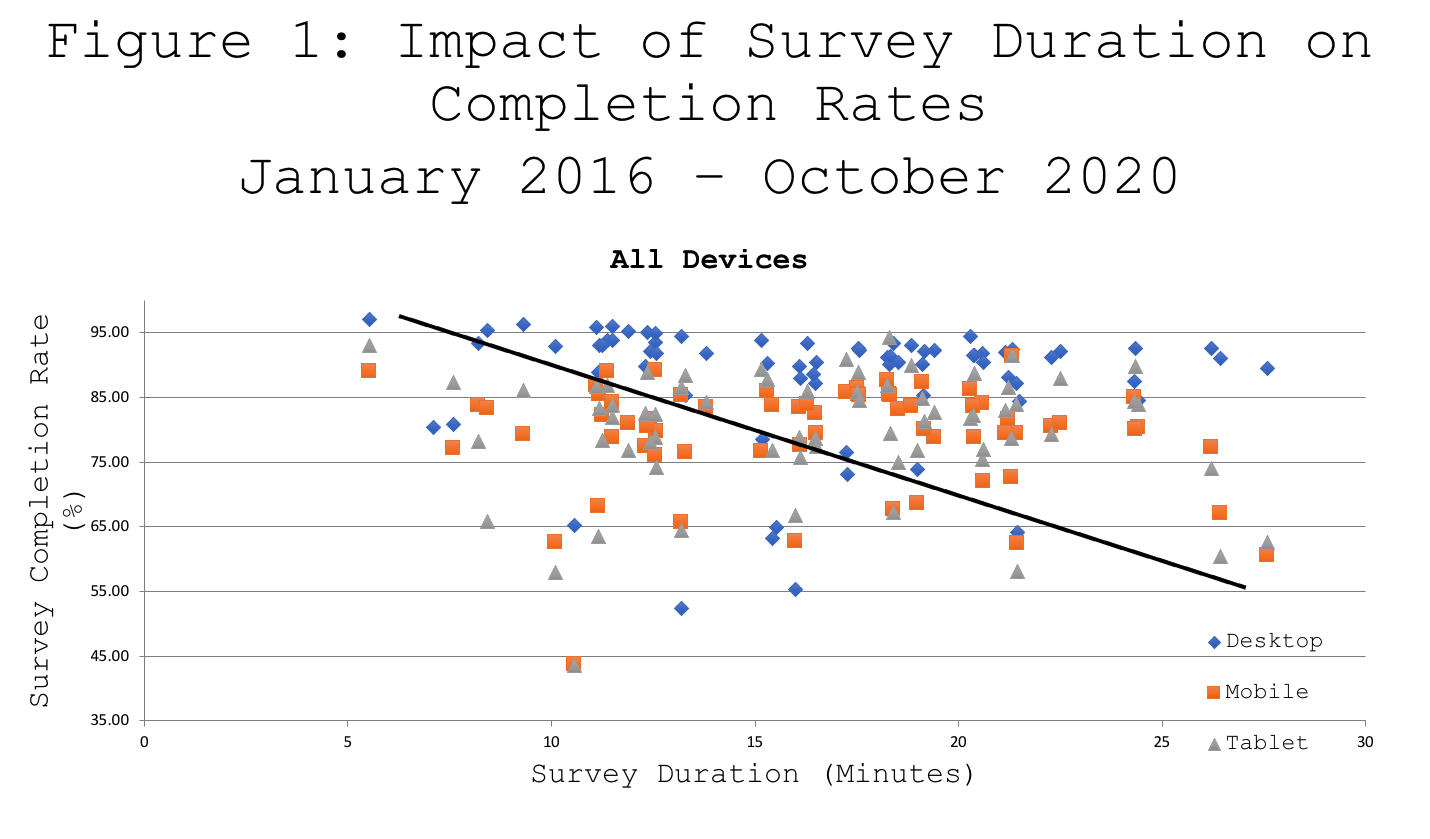
Mapping the results of 98 syndicated surveys conducted since our last investigation in 2016 by completion rate/survey duration, you’ll see a cluster of individual surveys at the 13-minute mark, our current target. At this point, roughly one in six of our survey participants will have abandoned the process. As survey duration increases to 16 minutes, roughly one in four participants have prematurely ended their survey experience. We’re accustomed to reminding ourselves to keep our syndicated surveys between 12 and 14 minutes, based on the data above, but does it accurately reflect the current reality of survey participation across device?
We’ve seen survey participation via mobile phone skyrocket over the last four and a half years. What used to be 60% completion via mobile is now 85%. If you’re surveying young consumers, expect them to be using a mobile phone and avoid the use of grid questions. While our current software platform senses device and renders a grid question as a series of single ask questions, we’re cognizant of the fact that a grid question with 10 rows will appear to a respondent as 10 individual questions on a mobile device, requiring addition time to complete each one.
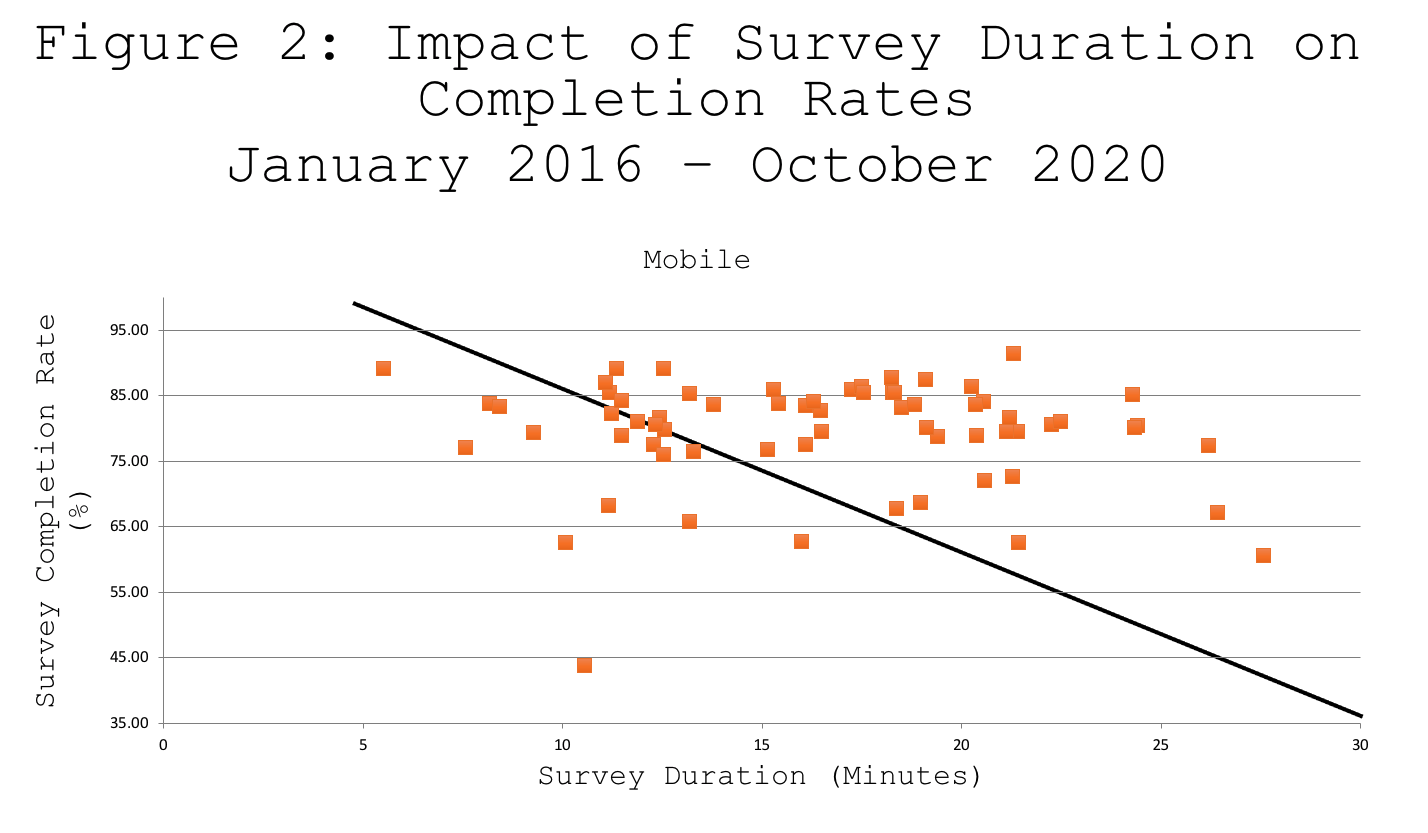
We’ve found that completion rates among mobile survey takers is, on average, 15% lower than among the less than one out of every seven participants that use a PC or laptop. Mapping the results of our same 98 syndicated surveys by completion rate/survey duration among mobile survey takers only, you’ll see that one in six participants will have abandoned the survey process at 11 minutes. As survey duration increases to 14 minutes, roughly one in four participants have ended their survey experience without completing. Anticipating that nearly all survey participation will be via mobile device, we plan to revise our duration targets to 10-12 minutes for all of our syndicated research.
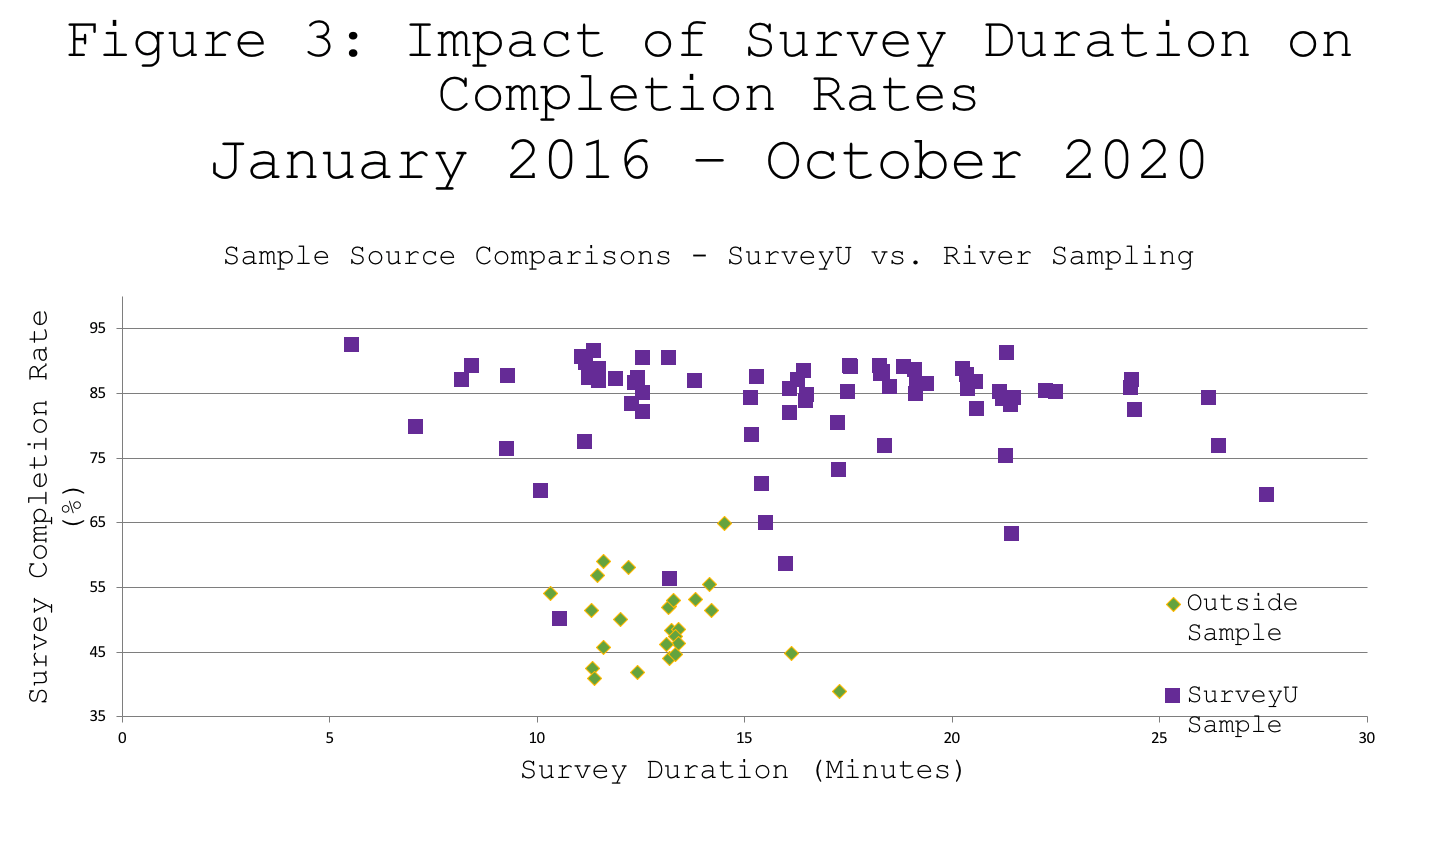
One last factor to consider is the source of the sample that you’re using. As previously mentioned, we have a proprietary panel and have used it for the majority of our syndicated research over the past four years. Given that we try to keep survey participation to one opportunity per month among our panelists, combined with the demands of our custom research projects, we have augmented our own panelists with those from outside sources, primarily river sampling providers.
Not surprisingly, we’ve found that respondents who we’ve obtained via river sampling methods are much less committed to sealing the deal. Across all 98 projects the average completion rate among our panelists is 83%, while the average completion rate among participants derived via river samples is 50%. This makes sense in that river sampling redirects a wide range of participants to surveys in real time while panels invite a participant via text, e-mail or app. Behind each unclicked invitation are these less committed participants who either do not respond to our invites or don’t join the panels.
For river sample participants, they play our game only as long as it interests them, abandoning when bored or if asked for more than they’re willing to give. Is it good for surveys to have casual respondents involved? Yes, but only in as much that researchers can keep them engaged. It certainly speaks to the need for contact quotas to better understand who researchers are losing along the way.
Short and sweet
Regardless of the device that the participant uses or sample source, if your goal is to deliver a representative sample, you owe it to yourself (and your clients) to keep your surveys short and sweet. Every minute of duration has an impact on completion rates. While you can indeed administer a 20+ minute survey, you’ll find that you’re interviewing only those who possess atypical dedication and stamina.
Furthermore, the days of asking demographics last are over. You want these to be the first few questions asked in order to determine who you’re losing along the way. Our analyses have shown that many more males start a survey than end it and, as described above, their tolerance thresholds are lower than females. Equally, the youngest members of our target audience are more skittish than older respondents, requiring care and attention to what we ask, in what order and how we can make our questions more interesting.
Finally, you’ll also want to think about from where you’re getting your participation. While we’re happy to blend committed panelists with casual river sample participants, you may have other priorities. If you’re seeking to reach out to disenfranchised communities, tread lightly. If you’re surveying your die-hard loyalists, you can expect more of a commitment.
Survey researchers need to make sure surveys meet young consumers’ high expectations, otherwise participants will become increasingly frustrated, rendering our industry an antiquated relic of the past.