The aisles have it
Editor's note: Rajeev Sharma is founder and CEO of VideoMining, a State College, Pa., research firm.
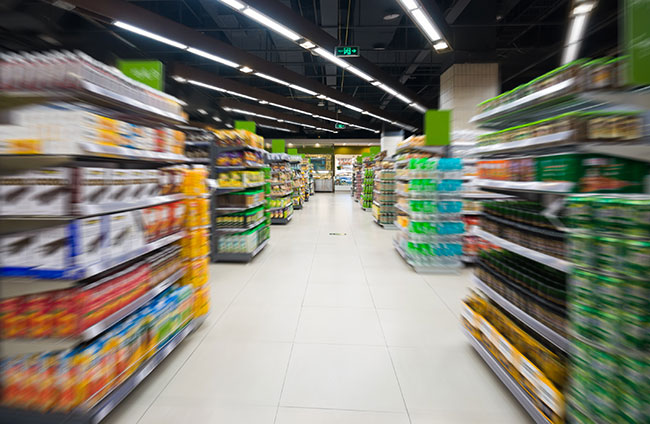
 Endcaps and other secondary product displays are crucial components of the shopping experience. They are the most important way for product manufacturers to stand out and reach busy, time-starved shoppers in-store. And they also are the area where out-of-store marketing meets in-store marketing.
Yet while retailers and manufacturers have proven the positive impact of displays and studied the impact of pricing on buyer behavior, there is a lack of data-driven insights on finer details of display activity: What is the optimal design and content of a display? What is the optimal location for a given display? What types of displays have the most stopping power? What factors are more or less influential on shoppers making a purchase decision?
As today’s retail environment is continually and rapidly changing, especially in light of COVID-19, addressing these questions with fact-based insights will yield more optimized performance for both retailers and manufacturers.
The discussion in this article revolves around the grocery channel based on VideoMining’s work within that channel but the general concepts can apply to a variety of situations in any brick-and-mortar retail environment.
Skims over critical points
Traditional market research methodologies, such as focus groups and surveys, do a good job at tracking consumer sentiment. That information typically links in with sales data, which tracks market factors. But going straight from preferences to sales means you only infer what happens within the store itself. However, with over 70% of purchase decisions reported to be made in-store, merely inferring in-store behavior skims over the critical points of potential influence for a majority of shoppers.
Even more direct methodologies such as shop-alongs or shopper intercepts can fall short, because people act differently when they know they are being observed. Sometimes, they simply may not accurately remember their shopping trip at the level of detail needed to produce good data.
A powerful example of this was a VideoMining client who created a meal solutions endcap display – a concept featuring multiple complementary products designed to make building a meal simple and affordable. To research its effectiveness, our firm performed shopper intercepts alongside unobtrusive in-store behavior analytics. Seventy-three percent of surveyed shoppers said the endcap was a “viable one-stop meal solution.” But only 7% of buyers actually purchased more than one category from the endcap!
Another recent example comes in the wake of the COVID-19 pandemic. In grocery stores, shopping time (the amount of time a shopper stops to engage with the products on the shelf) decreased over 10% across all categories immediately following the outbreak. That clearly demonstrates how outside factors can impact what shoppers do within the store and where and when they are open to influence.
In-store behavior analytics can bridge these gaps – between preference and purchase decision, between shopper and consumer, between shopper and buyer – by directly and unobtrusively measuring shoppers at the moment of truth. The goal is to capture what really matters to shoppers at the point where they vote with their wallets, without having to rely on their memory or honesty.
Reach out to shoppers
Displays are one of the most direct in-store applications of shopper marketing. It’s the one area where any brand, retailer or product manufacturer can reach out to shoppers in the store on their own terms (for the right price, of course).
Displays serve a variety of purposes in grocery stores, such as encouraging impulse purchases, reminding shoppers of a product late in their trip, promoting the discovery of new products and serving deal-seeking shoppers. All of these behaviors serve to build baskets without necessarily cannibalizing the primary aisles for these categories, leading to a win-win for retailers and manufacturers.
Because of the dynamics of retailer and manufacturer relationships, and the fact that display infrastructure is built into the shelves of the store, display areas are effectively a sunk fixed cost. The investment is premade regardless of results, so optimizing display activity achieves benefits for the same end price.
Three metrics
The key historical barrier to understanding the value of display locations is the lack of in-store data. VideoMining’s technologies aim to address this gap by measuring real in-store shopper behaviors with video and Wi-Fi sensors.
Specifically, three metrics address total display performance – including incremental sales generated by the display as well as the display’s ability to drive traffic to the primary stocking location of the categories on display – in order to assess the value of the display in its location:
Exposure rate measures the amount of traffic that passes a particular location relative to total store traffic. This metric can be used to compare locations within a store to determine which ones receive more traffic than others.
Engagement rate measures the rate at which passersby take interest in the items at a location, including visual or physical interaction with the items. This metric represents active shopping for people in that part of the store.
Relative directional traffic flow measures how much of a location’s traffic is moving toward another specific location. This metric can be used to determine the traffic dynamics in relation to the promoted item’s primary stocking location or even a complementary product or category. For example, a salsa display could be used to encourage shoppers to make a trip to Salty Snacks (for complementary tortilla chips) as well as Condiments or International Foods (primary stocking locations for salsa as well as complementary products). It all depends on the layout and assortment of the store along with the desired result of the promotion.
We aggregate the paths of individual shoppers using AI and machine learning to develop a general understanding of how traffic flows through the entire store. Only by understanding the flow of traffic on the macro level can you begin to understand how traffic flow affects the performance of individual displays and their locations.
Based on folklore
Our research has shown the location of a display can impact its performance by as much as 600%. Yet the assignment of display locations to specific promotions is often based on folklore and historical practices, not data and facts.
A Category Management Association whitepaper (Revolutionary In-Store Insights: Endcap Displays and the Shopper) laid the framework for the discussion on display locations. This paper made two important contributions to the industry’s understanding of display location performance:
Some display locations are inherently more valuable than others. An obvious example to illustrate this concept would be to compare an endcap facing a high-traffic perimeter category such as the meat cooler to a secondary display tucked in the back corner next to the bathrooms. The endcap by the perimeter category will obviously have more eyes on it, making it a more valuable location to place any display.
Display performance depends on stocking locations of the products displayed. Display performance will be affected by the primary location of the products displayed as well as the location of categories complementary to the products displayed. This depends on how shoppers typically shop the displayed categories as well as the order in which a typical shopper will encounter the different locations.
Without data-backed research, manufacturers are just guessing about which location is optimal for their display and retailers are just guessing the value of their display spaces.
And while the actual display placement decisions are not made by the manufacturer, any improvement in display locations adds to the effectiveness of their spending. Manufacturers’ trade spending can be one of the primary sources of leverage in the retailer-manufacturer relationship. A manufacturer armed with data-driven insights that lead to improved display outcomes can demonstrate category leadership and put themselves into better position to influence other category decisions.
Therefore, any work to optimize the locations of displays will enhance this effect and continue to be a win-win. This idea leads to a few key questions that address both perspectives:
- What is the best location for a given display?
- What type of display would best fill a given location?
- What is the ideal combination of all displays across the entire store?
- What is the monetary value of a specific display location?
The answers to these questions guide decision-making by both retailers and manufacturers from tactical, day-to-day display decisions as well as broad, strategic decisions. This makes research on display location useful for the practitioner up through the leadership levels of any retail organization.
While this article only goes into detail on display location, many of these same data-driven methods and principles are applicable to other elements of optimizing displays, such as pricing, pack size, assortment, visual elements, the physical construction of displays and more. For any display activity, measuring shopper responses at the shelf is the most accurate way to quantify the effectiveness of a given display.
Location best practices
Our firm works with retailers and manufacturers to study the effectiveness of different display locations using in-store behavior analytics, including suggesting alternatives to existing display concepts. The final output is a set of location best practices that can then be broadly used by the sales organization when negotiating trade marketing.
For example, to support the launch of a new product, a manufacturer may choose to use an endcap on the primary category aisle to highlight the new product to loyal buyers of that category. Alternately, a secondary display in a high-traffic area or near a complementary product may also be effective. By measuring shopper responses to these displays in real-world shopping scenarios, you can understand the effectiveness of new product displays to ensure that the current product launch succeeds and that future product launches in the category can apply those principles.
Similarly, many displays support occasion-based marketing, whether that occasion is seasonal, a holiday or even a trip mission (such as snacking, taco night, cooking out, breakfast). All these occasions will require different approaches depending on the type of display, number of categories displayed and the layout of the store in regard to the primary stocking locations of the products on display. These factors all can affect the performance of a display and determine whether shoppers are influenced to make a purchase.
Furthermore, not all displays have the same goal. Some displays are intended to be a one-stop shop for a set of complementary products that will build baskets by driving sales of the products displayed. Other displays serve secondary functions, such as driving traffic to the primary stocking location, reminding shoppers of impulse products at the end of their shopping trip or highlighting price promotions. In the wake of COVID-19, grocery retailers instituted one-way aisles, so displays could be used to provide alternative stocking locations to prevent a nearby category being blocked off from a high-traffic area. The ideal location of a display depends on its primary goal and it takes a detailed understanding of display location principles to be able to optimally place a display to satisfy its goals.
There is a balance of influence between a location’s inherent value, a display’s specific value in a given location and the contents of the actual display itself. Conducting research in-store accounts for those factors in order to optimize the display for real-world shoppers in real-world stores.
Case studies
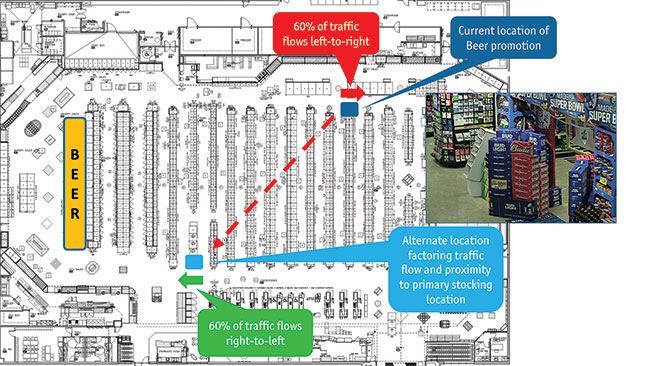
Beer promotion
In the grocery store depicted in Figure 1, a beer promotion was located in the back of the store in an area where traffic predominantly flowed away from the primary stocking location of beer. Analysis of a variety of alternate locations ultimately found that due to the direction and amount of traffic, a location in the front-left of the store would improve this display’s performance. This suggested alternate location could then be used in other stores with comparable traffic flows and layouts in order to generally improve performance of this promotion.
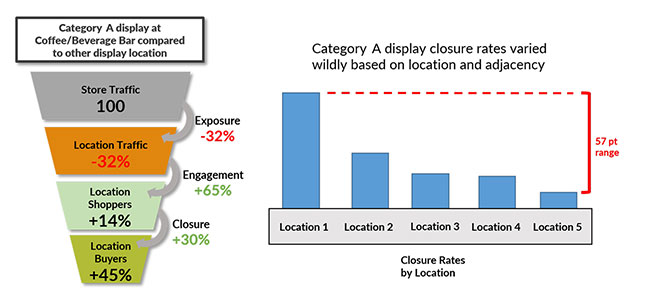
C-store
In this example, a product manufacturer tested multiple locations for a convenience store display. While the display at the coffee bar received less traffic, increased shopper engagement and closure led to more buyers and revenue when compared to other Category A display locations (Figure 2). This proved to the manufacturer that even though the coffee bar was not the obvious choice, shoppers were more likely to make an impulse purchase of their products when they were already engaged with preparing their hot drink.
Informational kiosk
This final case study involves a product manufacturer that had developed a new informational kiosk for grocery stores. This kiosk guided shoppers through selecting the correct product for their needs in a complicated category.
This kiosk tested well in focus groups, with users reporting a satisfying, easy-to-use experience and indicating that the kiosk did its job to help inform shopping decisions. However, when placed into a real store, the kiosk did not produce nearly as much sales lift as expected.
The manufacturer reached out to us to test what could be causing the problem. In-store behavior analysis found the simple solution: the kiosk was on the wrong side of the aisle! Store traffic flows favored the other side by almost 2:1 so potential shoppers were not even exposed to the kiosk.
Switching the kiosk to the other side yielded a 6% increase category interaction and a 10% increase in dollar sales per shopper. The kiosk itself was performing admirably but the outside influence of macro store traffic flows kept it from performing at its best in its initial location. Without analyzing the store traffic flows and shoppers’ at-shelf interactions, the manufacturer would not have been able to reconcile the positive results from the initial research with the poor real-world performance.
Closer to true motivations
Hopefully, this article illuminates some of the benefits of conducting research with in-store analytics for display optimization and why for any given display, testing assumptions in the real world rather than prompted environments gets closer to the true motivations of shoppers.
In-store behavior analytics can provide the insights needed to improve the decision-making process by marrying sales trends to in-store behavior analytics that quantify traffic flow and at-shelf behaviors of real shoppers. This information powers research that can then be used to develop guidelines for best practices for use in optimizing displays across many retailers or store types. In doing so, all stakeholders will benefit, as existing display budgets will generate the highest possible return on investment. And these fact-based insights help to bridge the gap between departments and teams within an organization, empowering a more cohesive marketing and sales plan.
Displays are the most potent advertising space in grocery stores. Just like how print, TV and online advertisements are measured for reach and impact, in-store advertising via displays must be accurately measured in order to inform future campaigns and optimize every marketing dollar.