Editor's note: Lori Dockery is lead research analyst at Vernon Research Group, a Cedar Rapids, Iowa, research firm.
My inspiration for writing this article came from a story by Dan Coates, MaryLeigh Bliss and Xavier Vivar in the February 2016 issue of Quirk’s (“‘Ain’t nobody got time for that’ The impact of survey duration on completion rates among Millennial respondents”) in which the authors compared median completion time with completion rate in order to find a rule for maximum survey length. At first, I only wanted to replicate their study with our respondents and see if my results would be similar. Once I began the task of reviewing our project data, however, I decided to expand the task to look at several additional variables. I wanted to be able to predict completion rate given my knowledge of other variables, too.
The task was bigger than I anticipated, largely due to differences in survey software. For example, some products did not capture survey completion time at all, while others captured elapsed time but did not take into account starting and stopping or leaving the survey open while doing something else for an extended time.
Also, I made the decision to only use studies which had been completed while I’d been working at Vernon Research Group in order to make certain I was accurately assigning some of the variables. This still gave me 104 unique data points over a four-year period. Many studies had unique situations for different participant segments, including different incentives and whether the client was masked or not, so each situation was treated as a different data point.
Relationship between completion time and completion rate
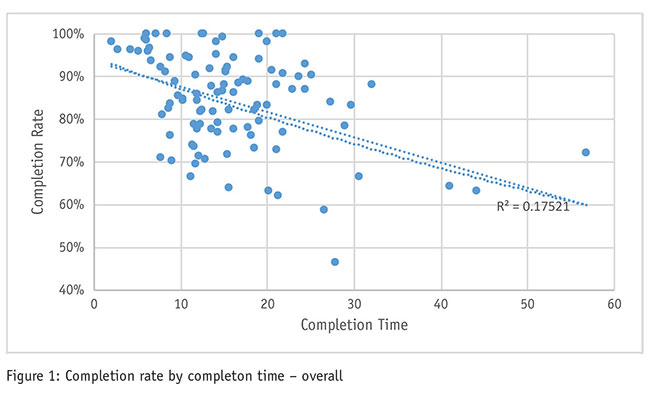
First, let’s take a look at the comparison of median completion time with completion rate so you can see how that compares to the findings of Coates, Bliss and Vivar. I used the time to complete each page of the survey instead of the total elapsed time to reduce the amount of error caused by respondents taking breaks from the survey. When calculating completion rate – the ratio of those who fully completed compared to those who started – I only considered respondents who had passed all screening questions, so the rates may be slightly higher than reality.
Completion time alone accounted for over 17 percent of the variance in the completion rate (Figure 1). The best fit for my data was a straight line, not a curve like Coates, Bliss and Vivar found. Just based on this evidence, there was no clear survey completion time indicated for keeping a high completion rate.

Vernon Research Group owns and maintains the Iowa Opinion Panel (IOP). The IOP is in an opt-in panel that contains thousands of Iowans as well as some residents in Western Illinois.
I decided to simplify my results and only focus on the surveys completed using the IOP, which parallels the focus used by Coates, Bliss and Vivar. Figure 2 displays these results.
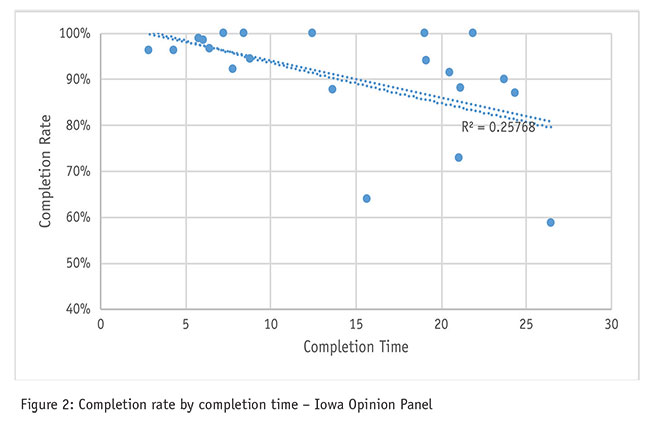
When reviewing the data with only the surveys completed by IOP panelists, completion time accounted for nearly 26 percent of the variance in completion rate. The best fit line was still linear, however, and it showed no clear drop-off point. At 14 minutes, however, we can see the first instance of a completion rate less than 90 percent. It is clear that longer surveys will have lower completion rates even with opt-in panels or lists.
Variables used in models
Now I’ll show you how I complicated matters. Below is a list of the variables I captured. Some are self-explanatory, while others I have defined. These models are based on all of the data I included, not just IOP-based studies.
Professionals vs. Consumers – Professionals was indicated if we were surveying a very specific type of profession, such as an architect or engineer. Otherwise, Consumers was indicated.
Local vs. National vs. International – Local included Iowa only. Anything including other states, even nearby states, was coded as National.
Incentive Was IOP Points
Incentive Was Drawing – The value of the gift to be given out was multiplied by the final likelihood of winning.
Incentive Was Gift Card
Incentive Was Report – Some surveys offered an overall report of the final results.
Incentive Value – This was the cash value of whatever incentive was used.
Survey Included Kano
Survey Included Conjoint
Number of Ads – Number of ads (videos, audio or images) each individual would see if they completed the survey.
Number of Numeric Boxes – Number of numeric fields each individual would see if they completed the survey. This included questions involving percentages and exact numbers that they might have to think about but not questions such as ZIP code or age.
Number of Open-Ended Boxes – Number of open-ended boxes each individual would see if they completed the survey. Each box available was counted and Others and contact forms were not counted.
Client Masking – If respondents knew throughout the entire survey who the client was, a value of 0 was used. If respondents never knew who the client was, a value 1 was used. If the client was unveiled at some point in the survey, the proportion of respondents (complete + incomplete) who dropped out before they reached the unveiling was used. Questions that were only about the client but phrased to be deceptive were considered as masked (e.g., “We have randomly selected one of the car dealers to ask you about for the rest of the survey.”).
Familiarity With Client/On a Panel – If masking was complete for all respondents and respondents were not on a panel, a value of 0 was used.
Median Time to Complete – Completion times were calculated by summing all of the page times in order to remove the error caused by people coming back to the survey to complete after time had passed.
Completes Needed – To create the models, the actual number of completed surveys was used. In practice, the model will be used to predict the completion rate, so the number of respondents needed will be used.
Full model
Because my primary reason for this study is to predict completion rates, I was most interested in the regression model containing every variable (Table 1). This model accounted for 53 percent of the variance in completion rates.
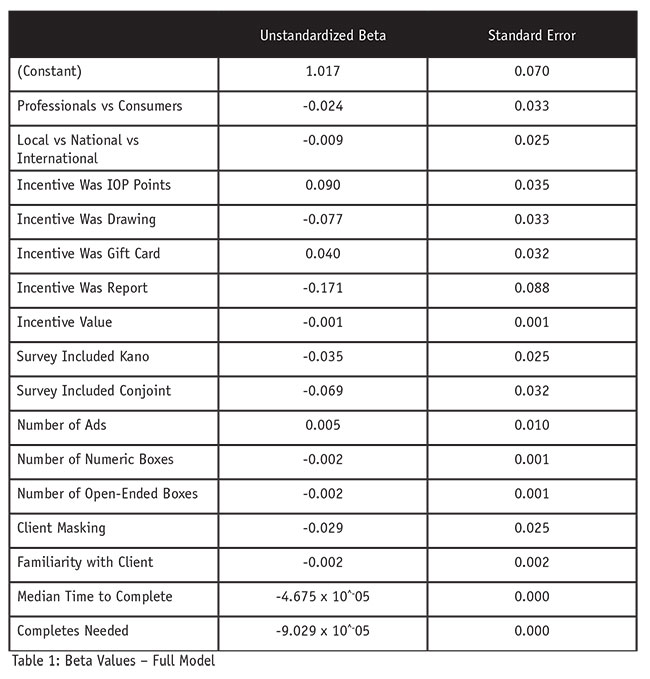
As an example, imagine a study where you will be asking an international sample of 100 mechanical engineers to view an ad that was published in a trade journal. Based on internal testing, the survey will take 10 minutes to complete. We are offering a $100 Visa gift card in a random drawing. The invitations will mask who the client is but it will be obvious to respondents once they get to the ad.
Using the formula to predict the percentage we can expect to complete the survey once they’ve gotten through the screening questions, we have:
Completion rate =
1.017 (this is the constant)
- 0.024 x 1 (professionals receive a value of 1 vs. the 2 that consumers would receive)
- 0.009 x 3 (international studies receive a value of 3 vs. the 1 or 2 that local or national studies, respectively, would receive)
+ 0.090 x 0 (not offering IOP points)
- 0.077 x 1 (incentivizing via a drawing)
+ 0.040 x 0 (not giving out gift cards to everyone)
- 0.171 x 0 (not offering a copy of the results)
- 0.001 x 100/100 (giving out $100 total, each respondent has a one in 100 chance of being selected)
- 0.035 x 0 (no Kano)
- 0.069 x 0 (no conjoint)
+ 0.005 x 1 (only showing the one ad that was published)
- 0.002 x 1 (we will ask respondents to estimate the percentage of the trade journal they actually read)
- 0.002 x 6 (one open-ended question about impressions of the ad and five asking respondents to list brands they think of the product)
- 0.029 x 0 (the identity of the client will become apparent by the end of the survey)
- 0.002 x 1 (we will ask a question that gauges how familiar they are with the client but it is a brand that we believe everyone will know)
- 4.675 x 10^-05 x 10 x 60 (it will take approximately 10 minutes to complete a survey and this variable is in seconds)
- 9.029 x 10^-05 x 100 (we need 100 completes)
Doing the calculations, the estimated percentage of respondents who will complete the entire survey after getting through the survey questions is 84 percent.
Correlations
Although I had enough for my own purposes, I went further and picked apart the results, beginning with seeing what each variable contributed by itself. Table 2 contains the correlations between each variable and completion rate.
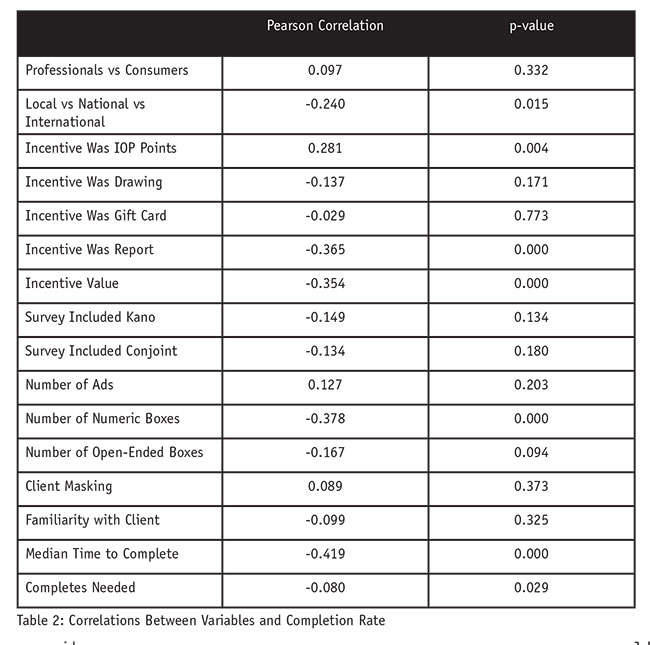
Most of these correlations made instant sense, but some required a little team discussion. For example, the finding that general consumers fill out surveys more readily than respondents who have specific professions was not new information. What was new was quantifying the effect.
Here are the effects I found:
- The more local respondents are, the more likely they are to either be our panelists or at least have knowledge of us, so they are more likely to complete our surveys.
- The Incentive Was IOP Points really was a stand-in variable for our own panelists, who are much more likely to complete surveys than the general population, even in our immediate region.
- As previous research has already shown, drawings are not the best incentive.
- The negative correlations for Incentive Was Gift Card and Familiarity with Client were not immediately explainable but they also had such large p-values that they may as well have had zero correlations.
- Reports are, apparently, not good incentives. We had not investigated this and had used the incentive in situations where we were unable to offer other incentives for assorted reasons.
- The negative correlation between Incentive Value and Completion Rate initially was baffling but, after discussion, we agreed that it was caused by the fact that we intentionally assign higher incentives when we know that the sample goals will be more difficult to accomplish. If we are looking for professionals or non-American respondents or if we know that the survey is going to be more difficult or take longer to complete, we already expect to offer higher than usual incentives. Thus, this variable may be regarded more as a stand-in for difficulty as judged by our team.
- The negative correlations for Kano studies and conjoint studies were understandable, because both exercises can be time-consuming or difficult to complete. The negative correlation for Number of Open-Ended Boxes was similarly understandable.
- The positive correlations for Number of Ads and Client Masking were not explainable but they also had such large p-values that they may as well have had zero correlations (the larger the p-value, the less likely there is any relationship at all).
- As expected, the longer it takes to complete a survey, the less likely respondents are to complete.
- The more respondents we need, the more likely we’ll see people drop out of the survey. This may be another stand-in for difficulty, or perhaps source, because we typically need to use other sources besides our panel for the larger samples.
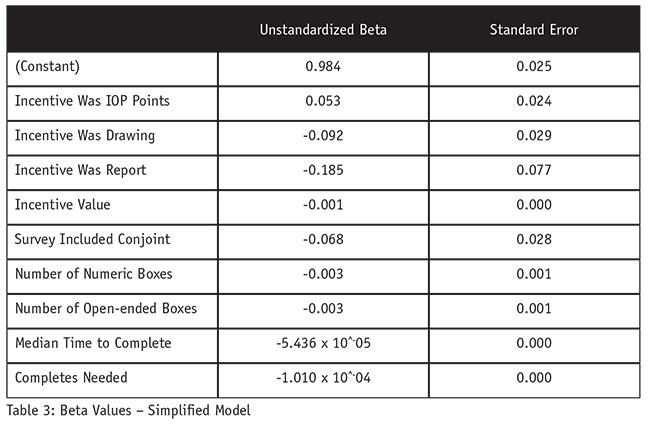
Simple model for forecasting
Going further into examining the variables, I used multiple methods to identify the simplest model that was not significantly poorer than the full model in its ability to predict completion rate (Table 3). The methods all agreed that the variables Incentive Was IOP Points, Incentive Was Drawing, Incentive Was Report, Incentive Value, Survey Included Conjoint, Number of Numeric Boxes, Number of Open-Ended Boxes, Median Time to Complete and Completes Needed together were most potent, accounting for 50 percent of the variance in completion rate.
With only four years’ worth of results, I have been able to show the value of key variables. Most importantly, I can use my model to try out different scenarios and have data to back me up when I suggest adjustments. I will continue keeping track of these variables for each of our studies and see how accurate the model is over time, hoping to improve the precision.