Editor's note: Kevin Gray is president of Cannon Gray LLC, a marketing science and analytics consultancy. This article appeared in the December 9, 2013, edition of Quirk's e-newsletter.
Segmentation is one of the most important methodologies in marketing research. There are many ways it facilitates better decisions and improves profitability. Segmentation can help us:
-
understand what motivates consumer behavior in a product or service category;
-
uncover patterns of consumer behavior and motivations and link them to characteristics (i.e., demographics);
-
see how brands are positioned within different needs segments;
-
know how well brands meet existing needs;
-
identify unmet needs;
-
retool existing offers to appeal to a broader range of consumer needs;
-
enhance new product development; and
-
improve customer relationship management.
Though there may be no universally-accepted definitions, there are at least four very different kinds of quantitative segmentation.
A priori segmentation develops statistical profiles of consumers that help understand and predict important marketing variables, such as brand usage.
Post hoc segmentation uses information collected from consumer surveys, customer data or other sources to classify consumers into groups that are relatively homogenous.
Brand segmentation reveals clusters of brands based on consumer perceptions or actual purchase behavior.
Driver segmentation identifies consumer groups with different priorities (drivers) with respect to one or more marketing variables, such as overall satisfaction or category usage frequency.
Let's now look at each of the four types of segmentation in a bit more detail.
A priori segmentation
In a priori segmentation we have a predetermined target variable (dependent variable) we want to understand or predict. This target variable, in effect, is a predefined segment. Typical data sources are attitude and usage (A&U) surveys, tracking studies and customer records. One simple example would be examining category usage (e.g., heavy, medium and light users) by consumer demographics. The target variable, or a priori segment, is user type.
Crosstabulations can be employed to profile these predetermined consumer groups but a priori segmentation also uses statistical techniques, such as logistic regression and CHAID or newer methods popular in data mining and predictive analytics. Collectively, these tools are sometimes referred to as supervised learning. They come into play because merely inspecting crosstabs may be insufficient since this cannot account for interrelationships among the predictor variables, the "stubs" in crosstabs. Multivariate analysis (i.e., modeling two or more predictors [independent variables] simultaneously), on the other hand, can provide rich insights invisible to the naked eye. We can also develop statistical models for scoring new or potential customers as likely heavy, medium or light users, in keeping with our example.
Application
Let's have brief look at an example of a priori segmentation. Men and women over age 18 were interviewed regarding energy consumption and related topics. The survey included questions about a new kind of air conditioning (A/C) system that is highly energy efficient. Respondents also evaluated a concept for the system in terms of likes/dislikes.
A key question was liking for the concept. A tree method called CHAID was used to identify respondent subgroups with the highest concept interest. Liking (top two-box/bottom three-box) was the target variable and nine demographic and behavioral variables comprised the predictors.
Interest in the new A/C system was not high, as just 21 percent indicated they liked the idea as described to them. Responses to open-ended questions suggested that some respondents had difficulty understanding the concept or found core claims hard to believe. Thus, some of the lukewarm interest probably resulted from the stimulus material itself and not the product idea. Furthermore, the CHAID analysis detected variation by respondent characteristics.
- Liking for the concept was highest (40 percent) among those without A/C or who use it lightly and who are under age 30. Possible explanations are economic or greater concern about the environment.
- High-income respondents who are not heavy A/C users and live in wood-frame houses had the second-highest liking (33 percent), as larger, wood-frame houses are often more expensive to cool.
- The metropolitan area in which a respondent lived was also associated with concept liking; interest was stronger in warmer climates.
Post hoc segmentation
In post hoc segmentation there is no predetermined target group. Instead, the task is to discover consumer groups that have marketing meaning and can be used in marketing planning. Post hoc segmentation utilizes information collected in consumer surveys or other sources, such as customer transaction records, to classify consumers into groups that are relatively homogenous and distinct from one another. Cluster analysis is the core statistical technique used to identify these segments (clusters) of respondents.
The segments are generally defined and profiled by consumer attitudes, consumption behavior and demographics. The data can be sourced from consumer surveys, customer records or other databases, or a combination in which soft attitudinal data are fused with factual data. Derived importance obtained from trade-off methods, such as max-diff and conjoint analysis, is another data source.
In occasion-based or motivation-state segmentation attitudinal data, importance ratings are often tied to specific occasions or motivations since the occasion or motivation for shopping a category can determine what is most important in choosing a brand. A classic example would be selecting a bottle of wine: Our choice would probably be very different when the wine is to celebrate a promotion than when it is intended for cooking - and we would use very different selection criteria!
K-means and hierarchical cluster analysis historically have been the most common clustering techniques, though newer methods are becoming popular, including those developed for data mining. It would be a gross understatement to say that there are many kinds of clustering methods, as well as many ways to use each method.
Application
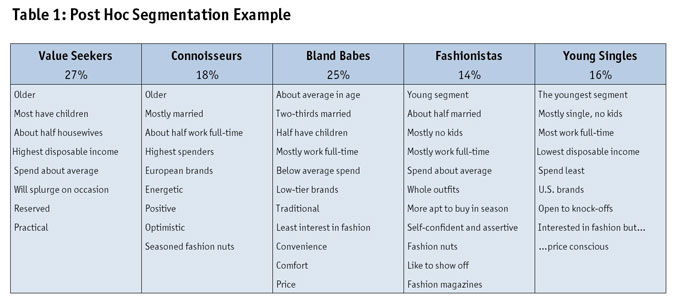
Table 1 shows some highlights of a post hoc segmentation study that was one component of A&U research among women regarding fashion.

Key findings and implications of the research included the following:
- The client brand was undifferentiated from competitors' brands.
- It lacked a clear target.
- There was some indication of room to move up-market through the introduction of brands not yet sold in the country researched.
- Channel strategy had been undifferentiated and needed to be better aligned with the brand portfolio.
- Fashion magazines and digital needed to be used more strategically; current marketing was somewhat haphazard.
Brand segmentation
As noted, brand segmentation resembles post hoc segmentation except that it segments brands rather than consumers. We identify groups of brands within a product/service category that are more similar to each other than to other brands in the category. We do this to reveal:
- the strengths and weaknesses of a brand, relative to competition;
- which aspects of a brand's image are most relevant to consumers; and
- what opportunities exist for extending the product line or introducing entirely new products.
Brand segmentation can use claimed purchases or brand image data from consumer surveys or actual purchase behavior from customer records. The analytics are normally quite simple - hierarchical cluster analysis, multidimensional scaling, correspondence analysis, factor analysis and biplots are common - and the results are often presented in the form of a brand map. Each method will give a somewhat different perspective of the market, though the differences may not be dramatic. Correspondence analysis, factor analysis and biplots are more informative than the other methods listed above in the sense that they show which brands consumers most strongly associate with which attributes, in addition to how the category is structured. Correspondence analysis differs from other methods in that, to some extent, it adjusts for brand size effect and provides insights into the relative strengths and weakness of brands.
Application
Following is a short example of brand segmentation. Consumers who purchase ready-to-drink non-alcoholic beverages were surveyed on a range of topics, including consumption of functional drinks.
Brand image of the leading functional drink brands was also asked. Hierarchical cluster analysis and correspondence analysis were conducted and in each case results suggested consumers tend to perceive the leading functional drink brands as falling into one of two brand segments:
- Fun segment: associated with attributes such as youthful, innovative, unique taste, quenches thirst and suits me.
- Functional segment: nutritious, natural, high-quality, good for skin and good ingredients.
These findings helped the client better understand the reasons behind the patterns observed in actual purchase data.
Driver segmentation
This last approach combines post hoc segmentation and key driver analysis. It can be thought of as a blend of cluster analysis and regression techniques and, in fact, a method known as clusterwise regression is sometimes used in driver segmentation. More recently, various forms of mixture modeling have been favored.
First, what is key driver analysis? Key driver analysis is an all-purpose term for statistical modeling that attempts to identify how much influence different variables have in driving some consumer variable of interest, purchase intention, brand choice or overall satisfaction, to name three examples. For instance, a bank will want to know what service aspects are most important to its customers (e.g., courteous staff, user-friendly Web site, etc.). Another application would be in product testing, in which we try to identify the key drivers of liking or intent to buy and therefore ways the product can be reformulated or redesigned to increase sales.
Key driver analysis is typically a one-size-fits-all exercise, in which a single statistical model is built for all consumers in a sample. By taking this approach, we assume that everyone has the same needs structure. When this is felt to be unrealistic, the common remedy is to conduct analyses separately for prespecified groups (e.g., grouped by age or gender).
This shotgun approach has drawbacks, though. There can be many subgroups and we usually cannot know in advance which consumer groups are dissimilar in terms of drivers. For instance, we might suspect people in different age groups have different priorities when shopping Category X but that might not really be true. The actual driver segments may not be directly observable and characteristics we can see (e.g., age and gender) often only tell part of the story. Finally, there is an elevated risk of chance results and differences that may seem important may actually be artifacts of our having run many separate models, often on quite small subgroups of consumers. This can be a costly, time-consuming and precarious undertaking.
Ideally, we could conduct our analysis on all our data and simultaneously uncover groups of consumers with different priorities. There are now sophisticated statistical methods well-suited for the task but, as a rule, they are very computer-intensive. Fortunately, modern computers and software have advanced to the point that this is now feasible, even with fairly large data sets. Driver segmentation can be rather complex and time-consuming, however, and there will be situations in which distinct, actionable driver segments cannot be identified. A negative finding is still a finding, though, and not necessarily bad news.
Application
Let's now look at an example. In an A&U study, women were surveyed about skin care products. Facial cleansers were one of the products covered. In a section of the interview, respondents rated facial cleanser brands they knew on a series of attributes and on future purchase interest. Driver segmentation was conducted, with purchase interest serving as the dependent variable and the attribute ratings as the independent variables. Three driver segments were found (Table 2).
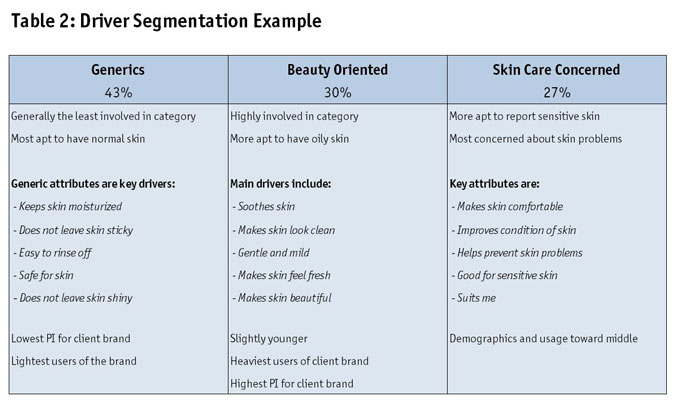
The largest group of consumers is not skin care fanatics and instead seek generic product benefits. On the other hand, as expected, many women are looking for specific product benefits beyond the basic must-haves. The client marketing team had sensed a need to refresh its brand and consumer priorities in this category were now more obvious. Also, from an R&D perspective, there is an engineering trade-off between formulating a product that offers certain benefits and one that doesn't irritate or harm the skin. These findings were incorporated into R&D planning.
Best practices in segmentation
For many clients, segmentation is one of the most valuable kinds of marketing research. It can be complex but even when simple, it can still go seriously wrong. When designing and conducting segmentation it's important to consider:
- how the market is structured;
- the hard facts about the market;
- your/the client's perceptions of the category;
- how you/the client are acting on these perceptions; and
- what you/the client most need to learn about this market.
Things to avoid include dumping a huge amount of data that has not been cleaned into a slew of algorithms and relying on software to select the best model for you. This could be nominated as an example of worst practice and, though it is not something an experienced marketing scientist should be tempted to try, in practice it is not exceedingly rare.
When using customer records, make sure you know what the candidate variables really are; internal databases are often shrouded in puzzling terminology and data maps may not be that informative or may even be misleading.
As with MR in general, who will be using the results, how the results will be used and when they will be used are of utmost importance. The data are critical and must link conceptually and practically with these considerations. It's very important to be focused and not to use data simply because you have it!
Last but by no means least, please be careful when designing your survey instrument, particularly attitudinal items. A shoddy questionnaire will kill any segmentation.
The phrase "Make everything as simple as possible, but not simpler" has been attributed to Albert Einstein. I don't know who said it first but this is sound advice.