Editor’s note: Kevin Gray is president of Cannon Gray LLC, a marketing science and analytics consultancy. Koen Pauwels is professor of marketing at Ozyegin University, Istanbul.
Traditionally, businesses have relied on gut feel and past precedent when developing marketing plans. Last year's plan was tweaked a bit to become this year's plan. But the times they are a-changin'. Marketers are under increasing pressure to substantiate their budgets with quantitative evidence. As a result, many are incorporating marketing mix modeling (MMM) into decisions. The Sarbanes-Oxley legislation is probably one impetus, along with the need to prove a return on marketing investment (ROMI). Beyond external pressures, marketers need to learn how their marketing activity – advertising, in-store promotions, price, etc. – connects with real movements in sales or market share.
Intuition, however deep, is no longer good enough. In a recent project, managers of an online retailer used their intuition to adjust last-click results when allocating the marketing budget. Our MMM analysis showed they were correct in allocating more to top-of-funnel actions, such as ads on affiliate Web sites.1 However, they did not go far enough and left money on the table. Moreover, their intuition was dead wrong on retargeting: They believed it should be highly effective but both last-click methods and our analysis showed this was not the case.
Also known as market response modeling, MMM uses historical marketing and sales data in statistical models to measure sales "bang" for marketing "buck." MMM is causal modeling in which researchers attempt to explain or predict market share or sales volume from marketing inputs, while controlling for other sales drivers such as seasonality and the competitive environment. It can be thought of as a form of key driver analysis with the addition of a time dimension. Estimating the relative influence of the various components of the marketing mix and forecasting future periods for demand planning purposes are both possible. In addition, what if simulations can be performed and are useful for judging the likely effectiveness of alternative marketing plans under consideration. The potential costs and benefits of the best candidates can then be weighed in order to decide which to implement.
The concept of MMM is not new and the term may have been used by Neil Borden as early as the 1940s. It began to crawl off the academic drawing board in the 1970s and now occupies an important corner of marketing research. Initially, it took root in FMCG categories and in Western nations but has since moved into a broad range of product and service industries around the globe. For instance, Unilever deployed MMM successfully in India to advise two of its brands on how to deal with the growing threat of a local brand.2 The analysis gave very different and actionable recommendations. Still, MMM is by no means ubiquitous and a strong case can be made that it remains underused. Factors that impede its universal adoption include complexity, misgivings about whether it actually works and the lack of a generally accepted standard methodology.
Taking a look at the methodology
MMM decomposes sales into two main components: baseline sales (which are mainly driven by factors such as seasonality, brand awareness and brand loyalty) and incremental sales (which are influenced by marketing activities). Each component will be explained in more detail in the case study discussed later in this article.
Although standard regression analysis is often employed in MMM, it is usually not the best choice since it is intended for cross-sectional data, not data that have been collected over time. Time series analysis methods borrowed from econometrics and other branches of statistics are better suited for these kinds of data, though structural equation modeling, path analysis, agent-based modeling and Bayesian networks are advocated by some working in this area. Time series analysis is a complicated topic but, in short, when we use ordinary regression on time series data our standard errors can be far off, with p-values usually being too small. Variables may therefore seem more significant than they really are. Second, in some cases regression coefficients can be seriously biased. Finally, we do not make use of information the serial correlation in the data provides because we have ignored the time dimension.
Historically, technological limitations favored single-equation approaches (e.g., multiple regression, transfer function models and dynamic regression). The implicit assumption is that companies and competitors do not adjust marketing based on sales feedback. This assumption may have been less problematic in the past when budgets and marketing plans were more rigid and difficult to change midcourse. In the modern world of marketing revisions, plans are often made quickly in response to sales figures, competitor activity or even macro factors such as economic conditions. This means that an easy separation between exogenous (independent) and endogenous (dependent) variables is not possible. For example, a sudden downturn in sales might lead a brand to launch a burst of advertising and an effect would then become a cause.
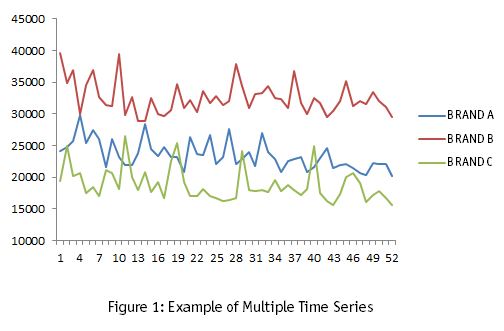
Because a simple division between the left- and right-hand sides of the equation may not be realistic, vector autoregression (VAR) and variations on that statistical theme are now commonly used in MMM. Christopher Sims was awarded the 2011 Nobel Prize in economics for this econometric approach, which allows flexible dynamics – including wear-in, wear-out and permanent effects – in large-scale models. In marketing, this form of multiple time series analysis is capable of modeling variables both as cause (exogenous) and effect (endogenous) and can also accommodate several brands simultaneously more readily than most older methods. Figure 1 shows a very simple example of a multiple time series of weekly sales data for three brands over a one-year period.

As with analytics in general, obtaining all relevant data is impossible and was not possible even in simpler times when advertising consisted mainly of TV, radio, print and billboard. Online, customers may change banner ad click-through, Web site visits and social media conversations based on marketing, which in turn stimulates sales. Another complication is different time intervals for important variables in the model. Online data is available in short time intervals, with sales data often available weekly and consumer attitude data only monthly.
Integrating online and offline customer metrics: A case study
A good example of time series analysis insights is the large-scale study by Google and GfK across 15 categories of durables (cars), services (Internet, energy, travel, lodging, insurance), food (cheese, butter, snacks, candy, dairy, beer, soft drink) and non-food (tissue, sanitary napkins) packaged goods.3 The 36 analyzed brands in these categories also differed substantially from each other with online spending ranging from 0.5 percent to 84 percent of the marketing budget.
The focus of the study was to explain and predict brand sales based on both direct marketing effects and indirect effects as captured by survey-based attitude metrics (awareness, consideration, preference, etc.) and online activity metrics (paid, owned and earned media). The data derive from several sources. As a key environmental control variable, we used temperature for fast-moving consumer goods (obtained from GfK) and the Dutch Consumer Confidence Indicator for durables and services (obtained from the Dutch Centraal Bureau voor Statistiek). Next, the 36 brands provided us with volume sales and marketing communication expenditures by channel. Fast-moving consumer goods also provided: price (average per volume unit), distribution (all commodity value) and promotion pressure (percent of unit sales sold on promotion). Second, GfK surveys measured the attitude metrics of brand awareness, consideration, preference, purchase intention, user status (trial/repeat/stable), usage and closeness to the brand. Online behavior metrics consisted of number of clicks on paid online ads, branded search, generic search, number of Web site visits, number of page views per visit, positive and negative social media conversations.
Our first issue was the timing of measurement: The online activity metrics are available in shorter time intervals (daily, even hourly) than sales and survey-based attitude metrics. We obtained the best model fit at the weekly level, where the signal-to-noise ratio of each variable type was best. Going to the daily or hourly level would have required us to control for day-of-week and hour-of-day patterns, and to divide weekly sales over smaller time intervals.
The second issue relates to the dynamic relations among marketing, survey-based attitude metrics, online activity metrics and sales. Some brand experts argued that online activity was simply a manifestation of underlying consumer attitudes. In time series analysis, this means the Granger causality runs from attitude metrics to online behavior metrics: if more people consider or prefer a brand, that brand will see more online activity.4 In contrast, McKinsey’s online consumer journey implies that online exposure can induce consumer to include a previously unknown brand in their consideration set and even purchase. This implies that (Granger) causality runs from online behavior metrics to sales and attitudes. And of course higher sales can induce more online activity, positive attitudes and an increase in marketing activity (sales performance feedback).
The third and final issue is the timing of all the effects. While marketing – as well as economic, psychological and sociological – theory may be strong on the direction of the expected impact, it is silent on the timing of that impact. As a result, time series analysis prefers to let the data speak, choosing lags to balance model complexity with forecasting accuracy. The results of this model specification are captured in impulse response function, displaying the net effects over time. Immediate (same-week) effects are followed by adjustment effects and finally permanent effects, if any.
The results revealed several new insights. We found feedback going both ways between survey-based attitudes and online actions. Online behavior does not simply reflect attitudes; it also shapes them. While online action metrics excel in sales explanation, attitude survey metrics excel in sales prediction. Managers can use both online and offline marketing to drive attitudes and actions. Online advertising is most effective in lifting quantity metrics such as search, clicks and visits but television ads grow engagement metrics of page views and positive social media conversations. For a specific chocolate brand, we found that TV advertising had a much higher sales effect through branded search (elasticity of 0.7 and 0.49) than directly on sales (elasticity of 0.13).
Limitations
Correlation may suggest causation but proving it is rarely possible. Non-linearities and variable interactions can also be challenging to estimate. Even with a small number of variables many models are possible and two or more may "fit" the data well but suggest different interpretations, each with different management implications. In addition, even good models can be thrown off by changes in economic conditions, competitor activities or other external factors. In the words of Niels Bohr, prediction is very difficult, especially if it's about the future. MMM is not a crystal ball.
Long-term effects of marketing – such as brand building – are hard to estimate since brand equity is part of baseline sales in traditional marketing mix models. Marketing activities that are effective at temporarily boosting sales, such as price promotions, can be damaging to the brand in the long run and MMM has been criticized for encouraging tactical thinking and price competition at the expense of brand building. Long-term MMM – such as vector autoregressive models – provides an antidote to such tactical thinking. Even if a perfect model were possible it would have to be correctly interpreted and implemented by decision makers. Sadly, good models are often ignored if they run afoul of preconceptions and organizational politics. This threat is pertinent to any application of statistics but because the stakes are so high it may be more common with MMM.
MMM is quite ambitious compared to most other statistical modeling and can be very misleading if important variables have been omitted from the data or if modeling is undertaken in a hasty, mechanical fashion. It is not easy and potential buyers should be wary of claims such as, "We are the only company that can do it right.” Nevertheless, MMM can be an enormously useful tool and substantially improve marketing decisions and ROMI. When undertaken competently, it can provide a scientific means of understanding what drives sales, how much return on investment the various components of the marketing mix generate and offer much-needed guidance in developing and refining marketing plans. MMM is not a complete substitute for expert judgment but it is becoming an indispensable supplement to it.
Further reading
Many books have been written about time series analysis and econometrics topics and perhaps the most well-known is Time Series Analysis (Box et al.). Other popular textbooks include: Time Series Analysis (Wei); Multiple Time-Series Analysis (Lütkepohl); Time Series Analysis by State Space Methods (Durbin and Koopman); Econometric Analysis of Cross Section and Panel Data (Wooldridge); and Econometric Analysis of Panel Data (Baltagi). For the technically inclined, two leading-edge academic publications are the Journal of Forecasting and the Journal of Time Series Analysis. Two classic books on MMM are Market-Share Analysis (Cooper and Nakanishi) and Market Response Models (Hanssens, Parsons and Schultz). One of us (Pauwels) has also written a book on how to build dashboards statistically linked to MMM titled, It's Not the Size of the Data – It's How You Use It.
1De Haan, Wiesel and Pauwels (2013), Marketing Science Institute Report 13-104, http://www.msi.org/reports/which-advertising-forms-make-a-difference-in-online-path-to-purchase/
2“From metrics to action: interview with Nicholas Chesterton, Unilever”, Marketing Intelligence Review 7, 1 (May), http://www.degruyter.com/view/j/gfkmir.2015.7.issue-1/gfkmir-2015-0007/gfkmir-2015-0007.xml?format=INT
3Pauwels and van Ewijk (2013), Marketing Science Institute, Report 13-118, http://www.msi.org/reports/do-online-behavior-tracking-or-attitude-survey-metrics-drive-brand-sales-an/
4The Granger causality test is a statistical hypothesis test for determining whether one time series is useful in forecasting another.