
Editor's note: Michael Lieberman is founder and president of Multivariate Solutions, a New York-based data science and strategy firm. He can be reached at michael@mvsolution.com.
At a recent conference the popular proposition was the employment of artificial intelligence (AI) within the marketing research analytic function. What was made clear is that AI still requires human intelligence. As sophisticated as it is, AI is not yet a self-driving car.
In addition to AI, the marketing research industry is talking about small big data – consumer information held within a company or corporate database that does not include social media data. In fact, open-source software now exists to work specifically with small big data. This article will display a specific use of these new capabilities for a traditional marketing research deliverable.
To demonstrate, I will take a core competency of the marketing research industry, market segmentation, and apply small big data methodology and AI to produce an actionable deliverable on a very large, non-survey based data set. This is, in essence, small big data.
Segmentation methods
Segmentation is the process of classifying a market or customer base into distinct attitudes or behaviors. The process entails segment identification, segment characterization, evaluation and target segment selection. Market structure, consumer perceptions, shopping behavior and branding images are all taken into account.
In the past, I have written about different types of segmentation – psychographic, behavioral and consumption driven. Two-step segmentation relies on multiple dimensions of characteristics and then applies several segmentations into a finite K-means.
A self-organizing map (SOM) or self-organizing feature map is a type of artificial neural network that is trained using unsupervised learning to produce a low-dimensional (typically two-dimensional), discretized representation of the input space – a map. In layman’s terms, the SOM function takes large amounts of structured data and turns them into a neatly organized map. The organization of the map can be used to create personal segments for marketing, political messaging or customer clustering purposes.
I will illustrate a segmentation method that draws upon mega-data sets that are not specifically structured to derive a segmentation. Examples of these kinds of segmentation may be the use of census data; customer or shopping data from a large retail chain such as Walmart or Target; social media use; or supermarket sales data.
What is a neural network?
Neural networks are an algorithm typically used in predictive analytics. The concept of the neural network is based loosely on the study of the brain and is commonly used in AI. Neural networks use Euclidean distance – those people who are naturally closest to each other. The algorithm is now easily available using SPSS and employing the R Project for Statistical Computing Kohonen algorithm. Inputs into SOMs can be census data, Monte Carlo simulation path analysis data or a database of customer purchases from a large supermarket chain. The sales data is entered into the Kohonen R, a data-mining algorithm in R for clustering/SOMs.
This algorithm has been around for several years. It has been widely employed in biology, engineering and finance and in epidemiological multivariate statistical analysis of cancer and health patients and how different lifestyles are related to the development of certain cancers.
Here is an example of a simplified version of the SOM technique:

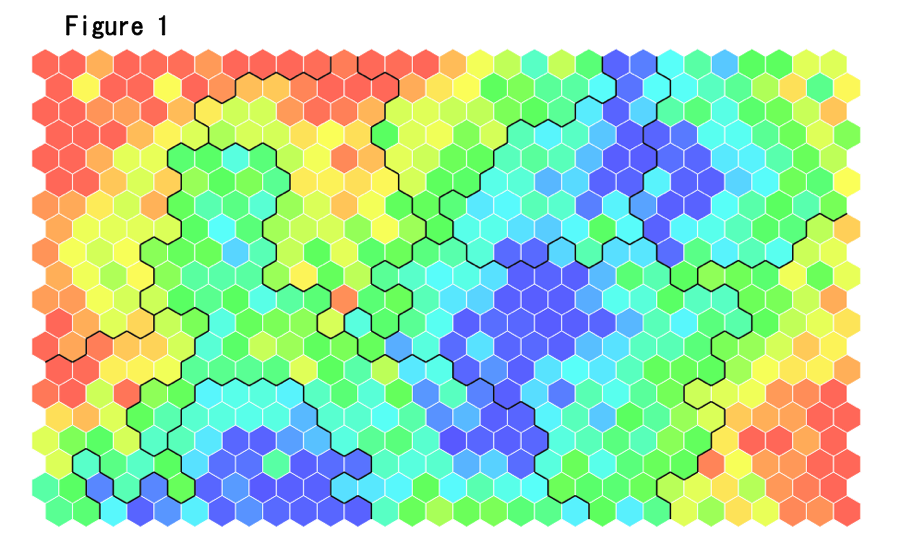
Everyone in the photo above is attending the Glastonbury music festival. Each person compares attributes – e.g., age, gender, salary and height. Everyone moves until they are closest to other people with the most similar attributes. If everyone holds up a card indicating their age, the result is a SOM heat map. At first the heat map is a random mix of colors like a 5-year-old’s finger painting. As people near others similar to them, the colors in the map become clear.
Eventually the photo of the people is going to resemble Figure 1.
For SOM segmentation, the examples will be slightly more scientific.
Example: Angus Hypermarket
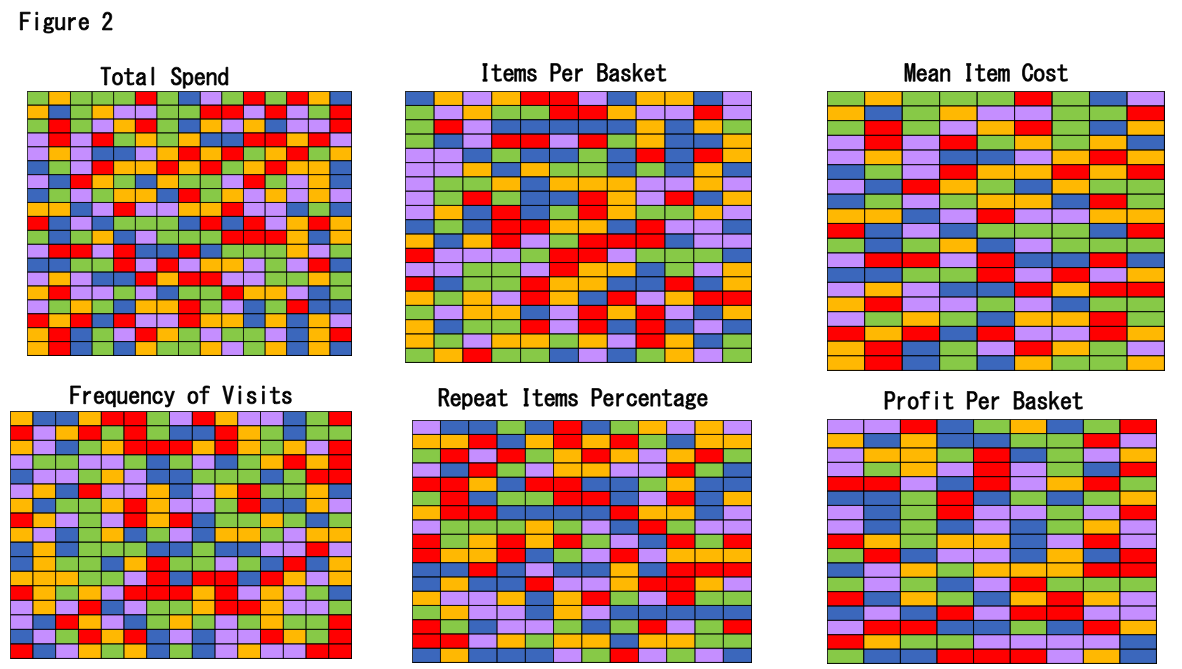
To illustrate the use of the SOM, I will look at an example from the fictional supermarket chain, Angus Hypermarket. Angus Hypermarket has supplied us with a large amount of data collected from its scanners. It has given us reams of data but we have chosen to concentrate their customer segmentation on six variables:
- total spend;
- items per basket;
- mean item cost;
- frequency of visits;
- repeat items percentage; and
- profit per basket.
Initial heat maps for the following are shown in Figure 2.
If the initial visual is a scatter plot of muddled colors, once the Kohonen algorithm is applied the respondents are clustered into groups that can be visualized by the map in Figure 3. Each color represents an actionable cluster.
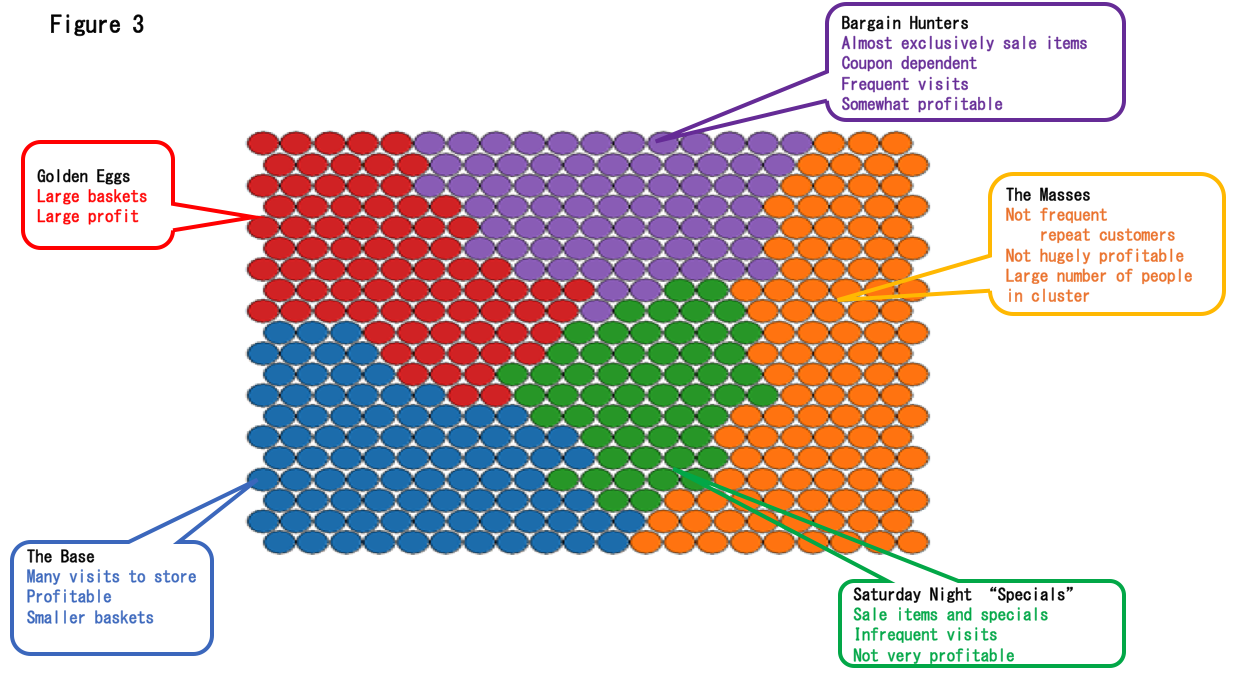
These clusters can be easily summarized and presented to the clients. Segmentation membership can be made into a database or tabulations for the client, just as with other segmentation methods. A reclassification scheme can be derived from survey or database methods. Coupons can be sent to specific segments depending on their purchase preferences. In short, all the functionality of a survey-based segmentation but one that is derived from big data.
Open-source software such as R allows marketing researchers to use not only known cluster analyses such as K-means and Q factor but also visual neural networks such as SOMs.
Generating revenue
Not every dollar spent on advertising and sales is created equal – some of those dollars generate far more revenue than others. Segmentation is a vital tool in the effort to determine which is which. Employing open-source, powerful software allows researchers to use SOM neural networks in analysis, adding an important quiver of multivariate clustering methods. As bandwidth progressively expands, it will become easier to deploy.